
Deep Dive: Local Legislative Spending
How does salary compare between service sectors in Cambridge?
Introduction
As an active resident, you’re likely aware of significant policy changes and important legislation in your local city. It’s these decisions that shape the way you do taxes, how you choose high schools, and which petitions to sign. But what actually goes into the smooth operation of a city government? More specifically, who dedicates their time and effort to these foundational pillars of a city, so that the average citizen doesn’t have to worry about lost tax files or insufficient public schooling?
To investigate this question, we conducted a case study of Harvard’s hometown. Cambridge, Massachusetts, was incorporated as a city in 1846, uniting three rival villages — Old Cambridge, Cambridgeport, and East Cambridge. Its City Hall, built between 1888-1889, was funded largely by a donation from Frederick Hastings Rindge. Now, the city boasts a population of 118,488, and functions as one of the most notable college towns in the world.
We decided to dig deeper and analyze the bare bones of how the city runs: salaries in different departments of the Cambridge City Government. We compiled data on salary changes over time, salary distribution, and growth rate.
Most Employees
Figures 1 and 2 show the job breakdown in each job department from 2017-2024. In 2017, Public Safety appears to have the most number of jobs by more than two times the second most populated job, at just above 800, while General Government (clerks, secretaries, etc.) falls at slightly below 200. Human Resources and Development and Community Maintenance and Development jobs appear to hold similar numbers at just above 300.
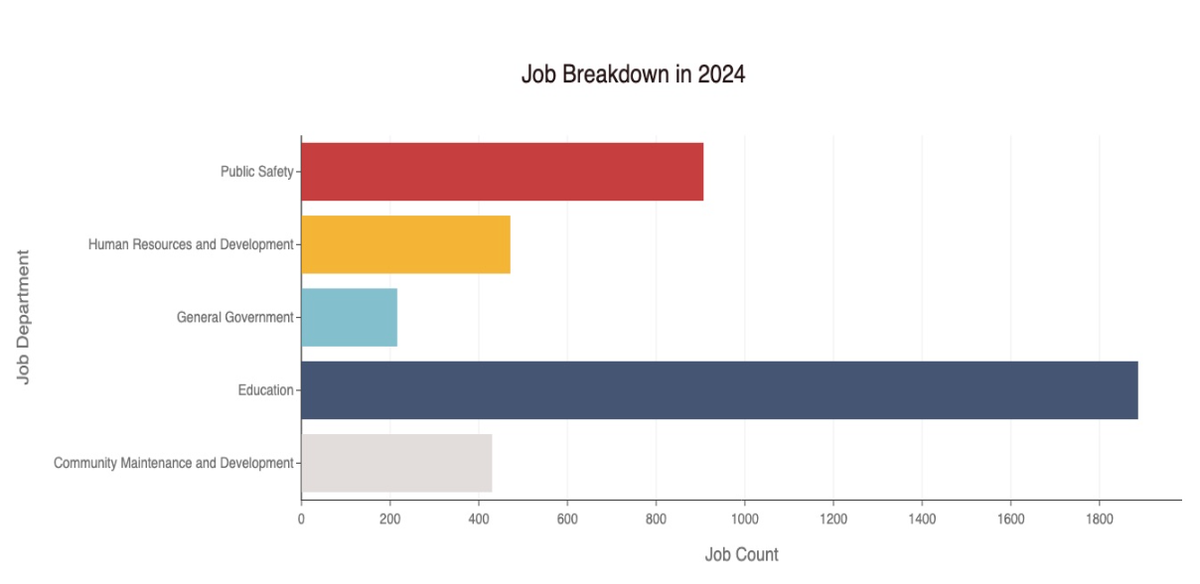 Figure 1: City Job Count by Department, 2024
 Figure 2: City Job Count by Department, 2017
Despite overall growth in the number of jobs in each department, this lineup remains consistent throughout the depicted years. In 2024, jobs in education were recorded at just above 1800, making it the most populated job department in the Cambridge City Government.
Job Salary Over Time
Figure 3 shows the average job salary over time by department. As depicted in the graph, the salary within each department steadily increased over the depicted years. General Government jobs maintain the highest departmental salary, starting at 80 thousand dollars and growing to 100 thousand, while Human Resources and Development fall at the lowest department salary, starting at roughly only 50 thousand and growing to 60 thousand. Public Safety and Community Maintenance and Development maintain similar salary levels, starting from roughly 70 thousand and growing to just above 80 thousand.
 Figure 3: Average job salary over time by department
In 2024, salaries in education were recorded at just above 80 thousand dollars, despite being the highest density job. While the salary remains less than General Government, Community Maintenance and Development, and Public Safety, it still outcompetes Human Resources and Development.
Growth Rate
Figure 4 shows the average salary trends over time by service. While all departments appear to grow at similar rates over time, Human Resources and Development starts at the lowest salary of 50 thousand, and the General Government starts at the highest salary of just above 80 thousand.
 Figures 4 and 5: Salary Growth Rate and Trends by Service
Figure 5 shows the growth rate over the years for each service. It supports the data trends observed in Figure 4 — similar growth rates for each job department. Public Safety has an interesting spike between 2018 and 2019, before evening out to meet the growth rates of the other three departments.
This salary growth has a few implications: inflation is continually increasing so salary rates could appear to be higher unadjusted, and jobs in government are obviously valued in the city of Cambridge.
Salary Distribution
Figure 6 shows the consolidated salary distribution for each department. While the job salary median in the General Government sector falls at 86 thousand, it has the biggest spread of salaries across all departments, with the highest outlying salary at 344 thousand. Community Maintenance and Development has the smallest spread with a median of 68 thousand and the highest outlying salary at 236 thousand — similar to Human Resources and Development, which contrarily has a median of 56 thousand.
 Figure 6: Consolidated salary distribution by service
Despite Education boasting the most number of jobs, its salary spread proves to be the most variable. The highest salary in Education stands at 266 thousand — unlike other job departments, almost all jobs fall into the quartiles, which ranges from 0 to 214 thousand, showing immense variation in departmental job salary.
Conclusion
While interdepartmentally, there appears to be variability in salary levels — with Human Resources and Development often falling short of other departments — job salaries and growth rates in the Cambridge City Government retained their vitality despite the inception of Covid-19 and a worldwide pandemic. Compared to national government employment, which declined by 1.3 million, dropping 6 percent, in 2020, Cambridge’s city government did a surprisingly good job at maintaining employment.