
Introduction
The housing system at Harvard has been a hot topic of discussion since its creation in the 1930s. While it can be a place of community, unity, and friendly competition it also leads to inevitable inequalities. In the past, the housing system was based on student preference and forms, so bias existed as different types of students self-sorted themselves into houses. This system was eliminated in 1995 to increase diversity within houses. However, the faculty, location, and amenities within each house are entirely unique. Whether it be differences in advising, food, or even in dorms, the disparities in Harvard residential life can be a source of frustration for many. Each house holds around 8-10% of the class size and the entire housing process is random, a fact that is often disputed among undergraduates at the university.
While many other disparities have already been reported by The Crimson, we wanted to focus on one sector that has remained underreported: Award Winners. Each year, Harvard awards over 233 unique awards to 500 recipients spanning the College and the graduate schools, from awards in mathematics to history to house-specific awards. Using the 2022-2023 Student Prize Recipients as well as the Alumni Directory Database, we were able to locate the recipients’ houses and concentrations.
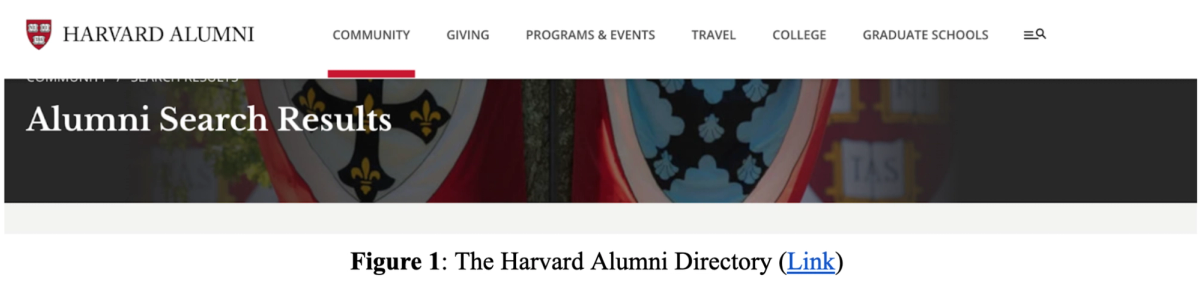 Figure 1: The Harvard Alumni Directory
After compiling the list of raw data, we examined the data across 3 categories: Class, House, and Concentration.
Class
Out of the 519 award recipients in the 2022 - 2023 school year, we have found that 444 of them were undergraduates, 73 of them were graduate students, and 2 were unknown.
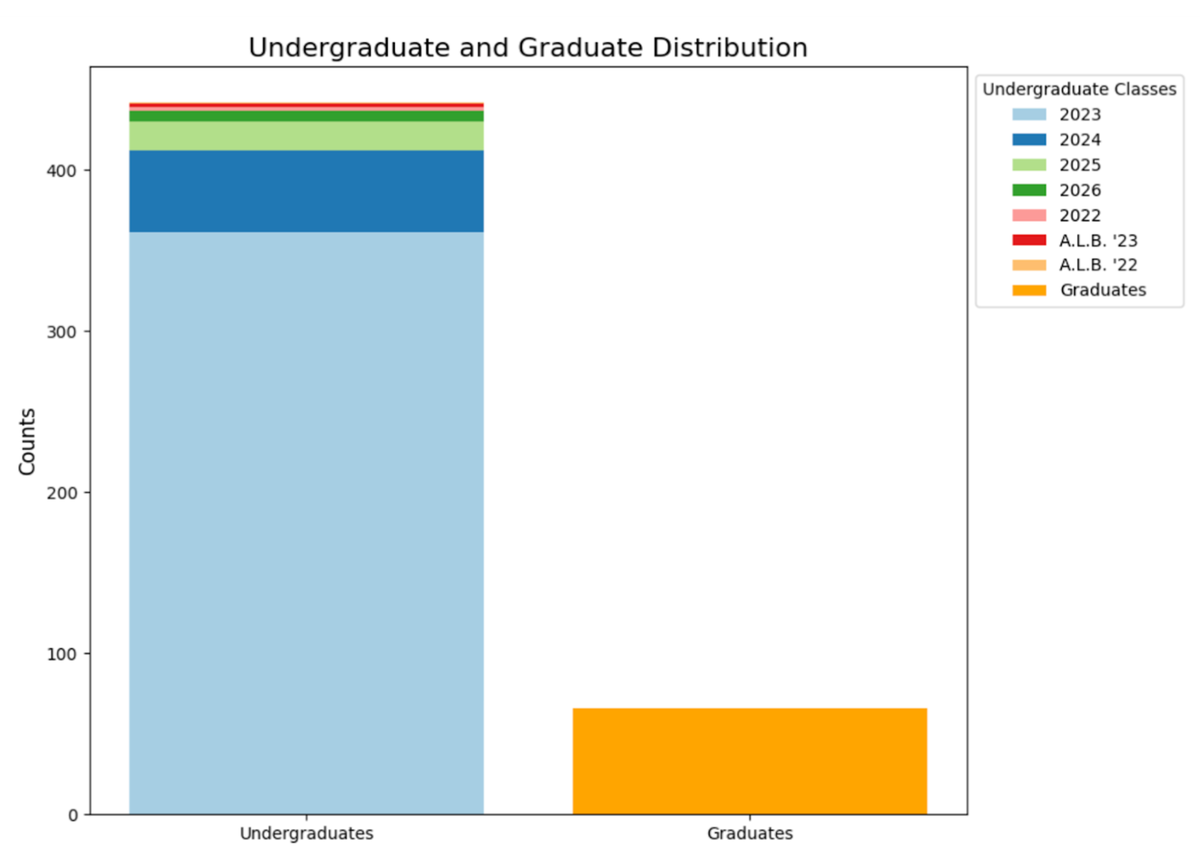 Figure 2: Distribution of class for awards winners
From the distribution within the graph above, we can see that a majority of the undergraduate award recipients are from the graduating class, with juniors, sophomores, and first-years following in that order. These findings make a lot of sense as seniors have more time and experience in university, but also because there are some awards that are exclusive to seniors only. Running some data on the awards with the word thesis or senior in it, there were 44 awards that showed up, which means there were at least 44, if not more awards that were exclusively awarded to seniors.
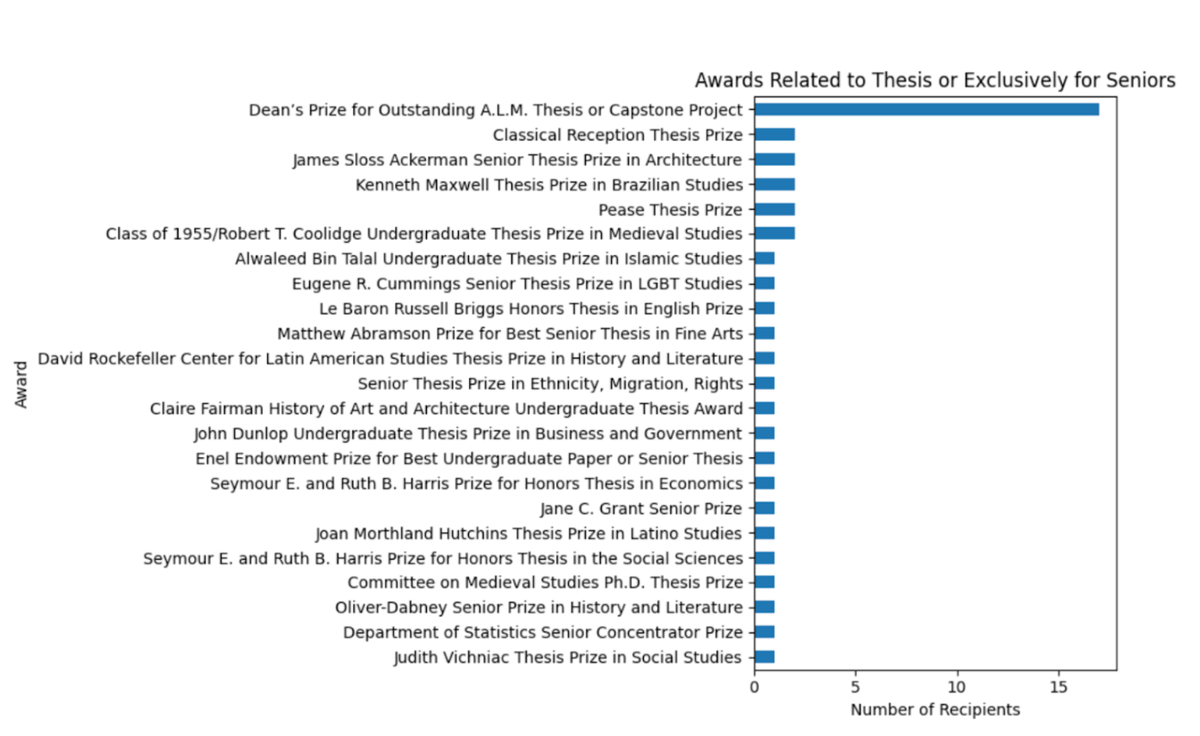 Figure 3: Senior-specific awards
House
Moving on to a more important discussion, does there exist a significant difference between the number of awards per house and if so, is that difference enough to indicate that the housing process is not as random as claimed?
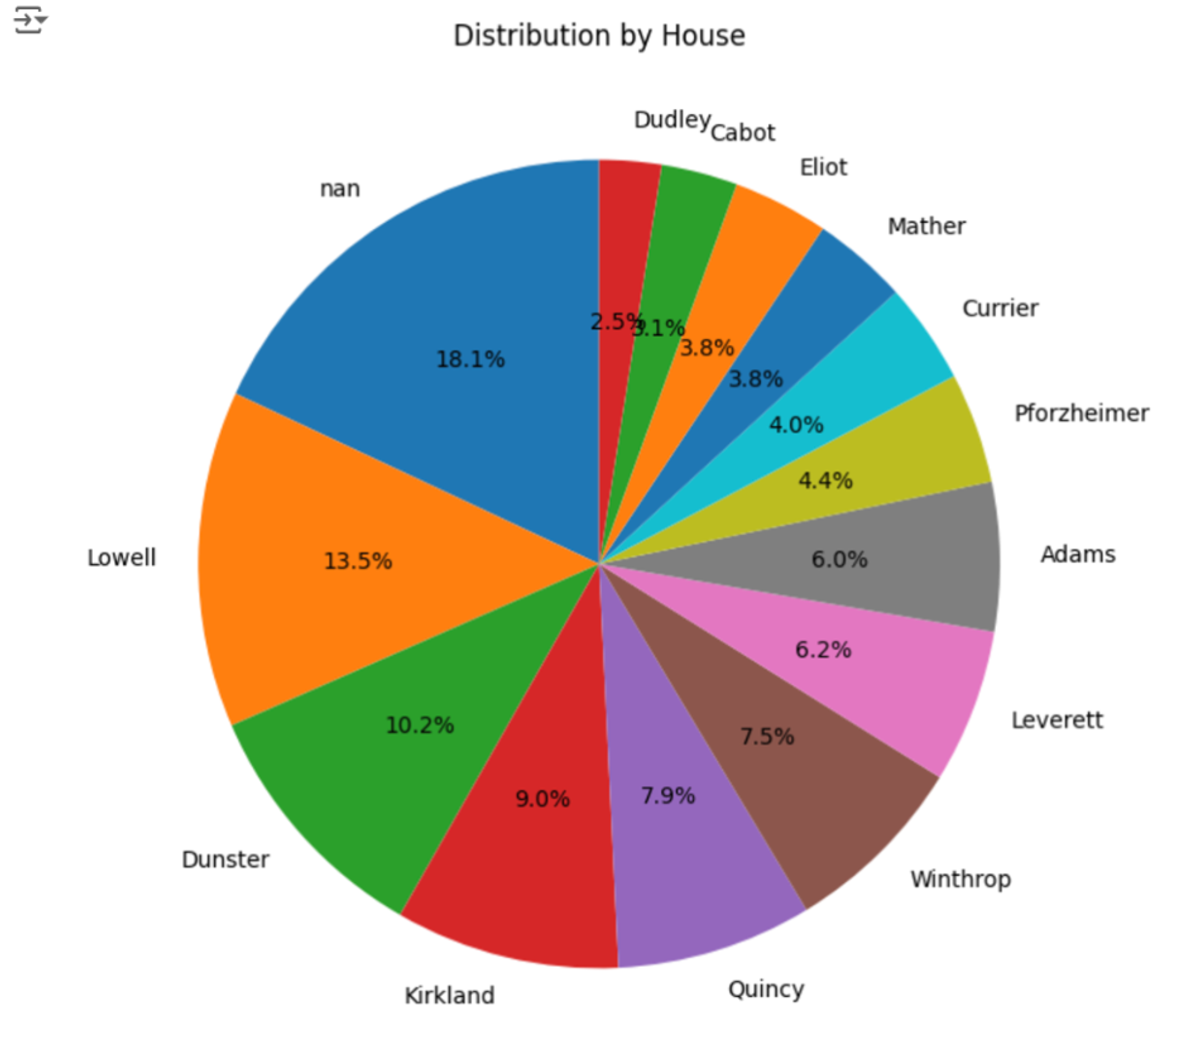 Figure 4: Tree map of 2022 - 2023 Harvard award winners by concentration
When looking at the figure above, we can do some basic data analysis to see if the probability of the figures displayed in the chart above occurring through random chance is unreasonably low. If we assume that Lowell is on the higher end of the population and has 10% of the upperclassmen population, the likelihood of Lowell having 70 or more award recipients out of 444 upperclassmen is nearly 0.01%. On the other hand, if we also assume that Cabot is on the lower end of the upperclassmen population, at 6%, the chance of Cabot having 16 or fewer award recipients out of 444 upperclassmen is 1.62%. Using basic hypothesis testing and assuming a fixed probability of success, we measured how extreme the observed result was compared to what our hypothesis was. It shows that under 5% significant value, we can see that both results are significant.
Using this analysis, we have reached the conclusion that a random probability of the above distribution of awards winners by house is very low. This has two implications– either, in this specific year, Cabot and Lowell really achieved this highly unlikely feat, or some underlying differences might exist within the different houses, impacting the sorting process and the number of awards winners.
Concentration
Next, we analyzed the data in the context of concentrations. We wanted to know if specific fields of study were associated with high achievement or if more awards were designed for a specific concentration, thus skewing the data for a specific concentration.
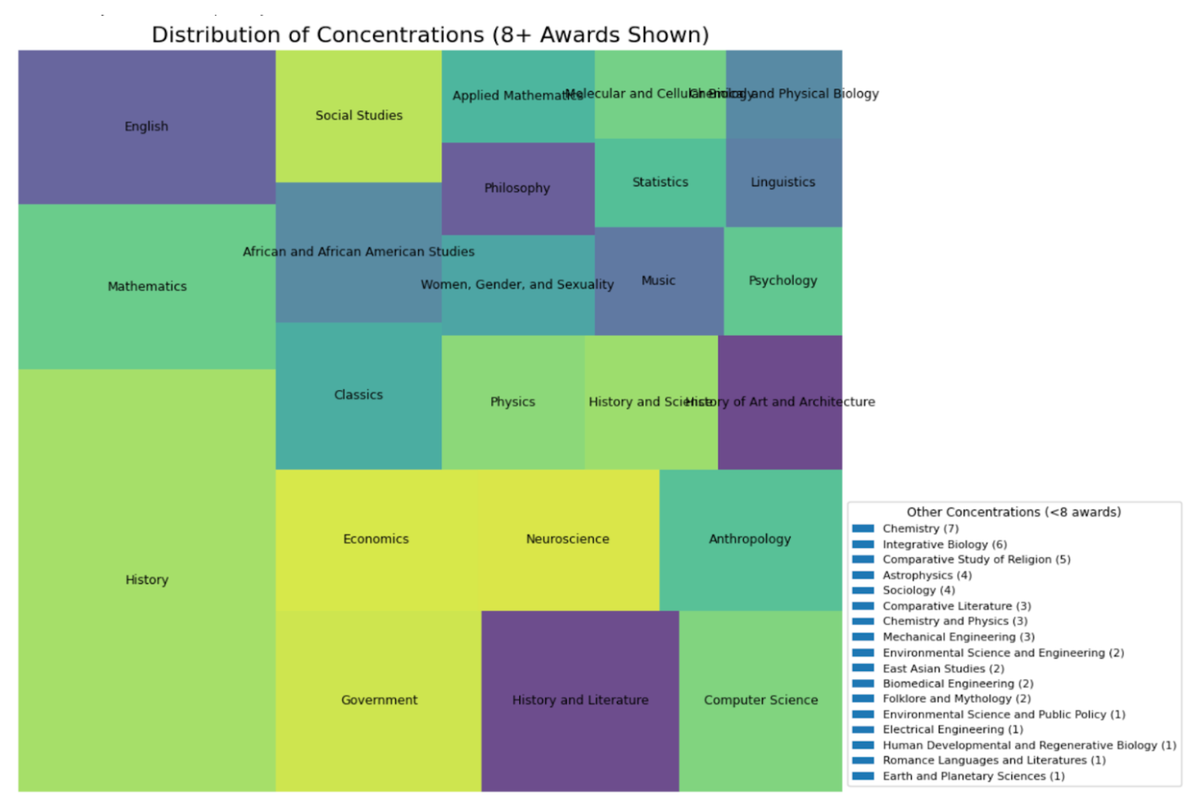 Figure 5: Tree map of 2022 - 2023 Harvard award winners by concentration
Looking at the tree map, there appears to be a disproportionate number of award winners concentrating in history, mathematics, and english. This discrepancy could be explained in two possible ways. Either there are a disproportionate amount of awards that are concentration specific, such as the Claire Fairman History of Art and Architecture Undergraduate Thesis Award which is specifically awarded to a student concentrating in the History of Art and Architecture concentration, skewing the data results in these concentrations' favor, or there are more students concentrating in history than any other major at the college and the relative percentage distributions are each concentration is proportional to the number of students in that concentration.
Now this second argument may be true as a prior investigation by HODP confirmed that concentrations where there are high proportions of winning awards tend to attract the most students.
Conclusion
Through examining the data, we can see that there may be an indication that the housing system might not be as random as we thought, yet this conjecture needs to be verified by going through years of data, as this one year could have been an outlier year in the grand scheme of the housing system.
Additionally, there are many nuances within the different awards that can be further examined, like the type of award or how “prestigious” it may be in comparison to other awards, but from the analysis so far we can conclude that there may be a noticeable discrepancy between the support systems at different houses.
However, until more research and datasets come to life, the housing system will remain a mystery.