
Harvard Housing Part 1: Who Gets Quadded?
First post in a series investigating housing at Harvard using data science and statistics.
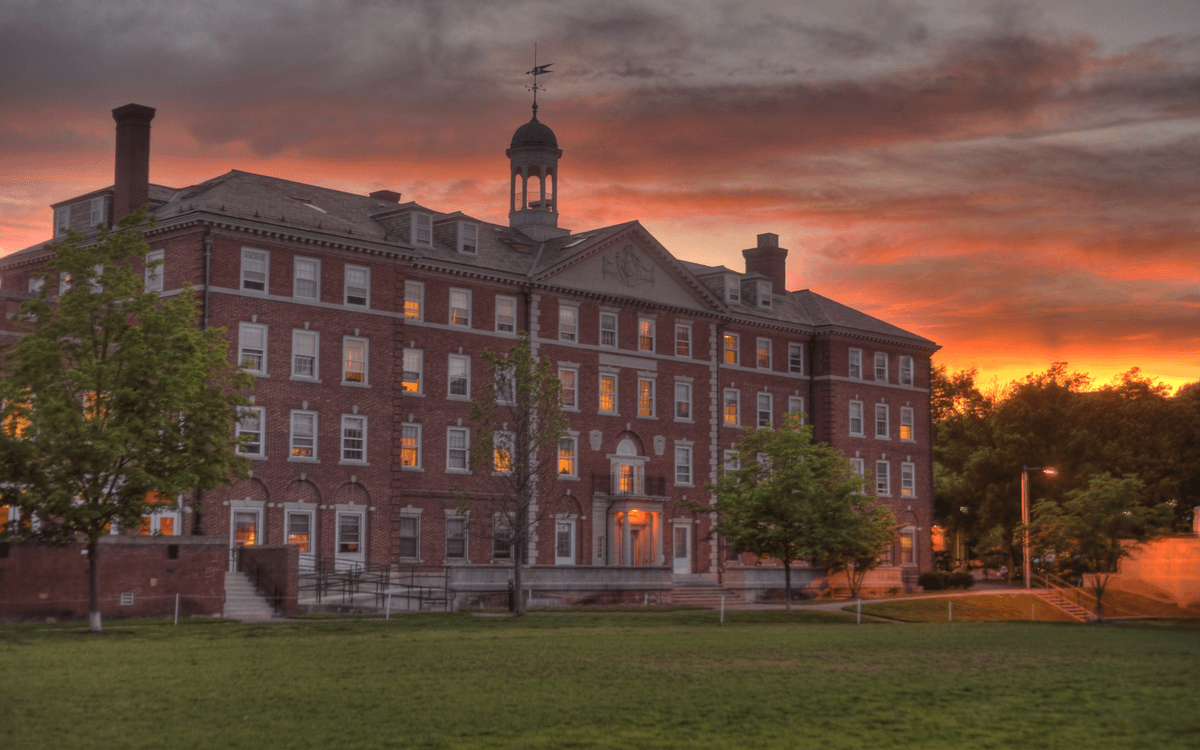
At the beginning of freshman year at Harvard, students are assigned a dorm and roommates. In the second semester, students enter the “housing lottery,” which determines the upperclassman house they’ll live in for the next three years. Each student enters this process as a member of a blocking group: a group of students who are guaranteed to be assigned the same upperclassman house.
Students can choose up to eight people for their blocking group, and they can also link with another group. Linked groups will not be in the same house, but their houses are guaranteed to be in the same neighbourhood. There are four neighbourhoods, each comprised of three houses: River East (Dunster, Leverett, Mather), River Central (Adams, Lowell, Quincy), River West (Eliot, Kirkland, Winthrop), and the Quad (Cabot, Currier, Pforzheimer). The Quad houses are farther from the heart of campus (Harvard Yard and Harvard Square) than the River houses, and as a result, many freshmen dread being “Quadded.”
Harvard claims houses are assigned randomly, but many students believe otherwise. There are countless rumours about factors that allegedly influence a blocking group’s chance of being Quadded. The most common include:
- Athletes are disproportionately assigned River houses
- Larger blocking groups are more likely to get Quadded
- Linked groups get Quadded more often, particularly if both groups are large
- Groups with many international students are usually Quadded
- On average, legacy students are Quadded less than non-legacies
Harvard does not provide data on the student make-up of upperclassmen houses, so we decided to collect our own and answer three main questions:
Are large blocking groups more likely to get Quadded?
Are linked groups more likely to get Quadded?
Are certain demographics more likely to get Quadded?
Data Collection and Cleaning
We created a survey that freshmen could complete from March 5, 2019 to April 12, 2019. In total, there were 834 respondents (approximately 51% of the Class of 2022). In addition to the survey data, we referenced students’ names, freshman dorms, and upperclassman house assignments from the Harvard College Facebook, scraped the varsity athletic team roster websites, and obtained a list of international students from the Dean of Students Office. Our final dataset contains 15 variables: three IDs (the student, their blocking group, and their linking group, where applicable), gender, ethnicity, room number, entryway (a smaller subsection of a dorm), freshman dorm, financial aid status, legacy status, athlete status, athletic team, international student status, blocking group size, and upperclassman house.
Using our survey data where respondents listed their blocking group leader, blocking group size, and the names of their blockmates, we were able to identify 271 complete blocking groups, which account for 1,412 students (86% of all students included in our study). Harvard reports that 1,653 students matriculated in the Class of 2022. In total, we collected data on 1,641 Harvard freshmen, or 99% of the class. We excluded students who cannot be found on the main Harvard College Facebook directory or do not have their upperclassman house listed on the College Facebook. We do not know for certain why some students are missing from the directory. In some cases, students took a leave of absence; in others, the students likely opted out of being listed on the directory in their privacy settings.
We decided not to make our raw dataset publicly available in order to protect student privacy.
Data Validation
A critical assumption underlying this project is that our data is a representative sample of the population (the entire Class of 2022). We believe this assumption is valid for two reasons:
Several freshman dorm entryways had a 100% completion rate. Harvard deliberately makes each entryway a representative microcosm of the student population, so dorm entryways are as close as we can get to random samples.
We compared our data with the results of a survey of over 60% of the Class of 2022 conducted by The Crimson and data made publicly available by Harvard. For all of the variables we measured (i.e., ethnicity, gender, international student/athlete/financial aid/legacy statuses), our results were very close to those of The Crimson survey and Harvard’s official data (Table 1).
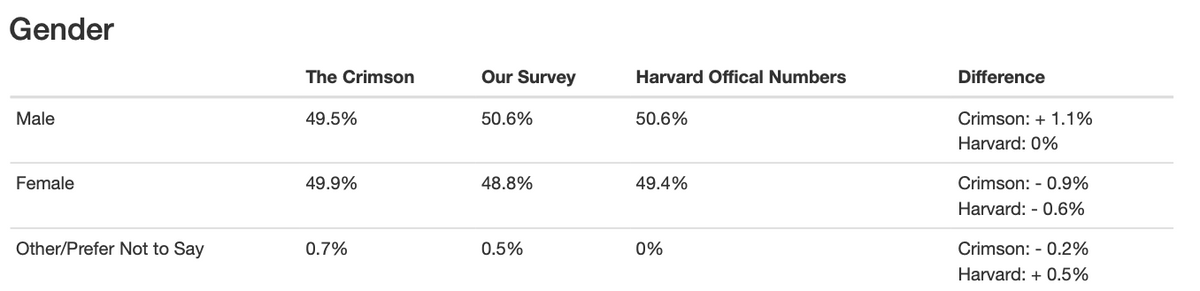 Table 1.1
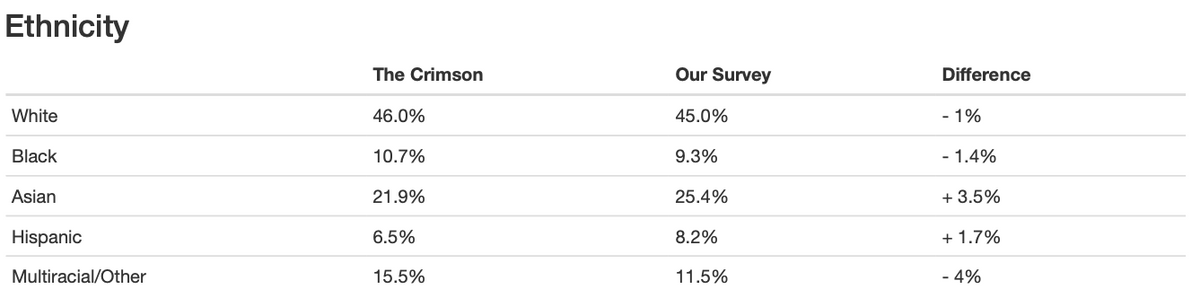 Table 1.2
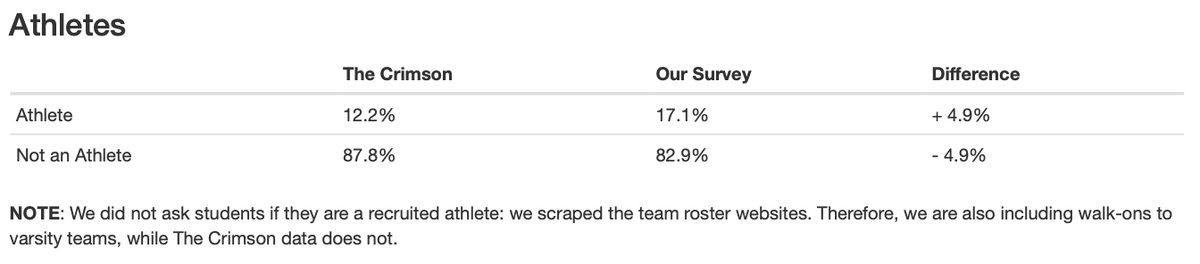 Table 1.3
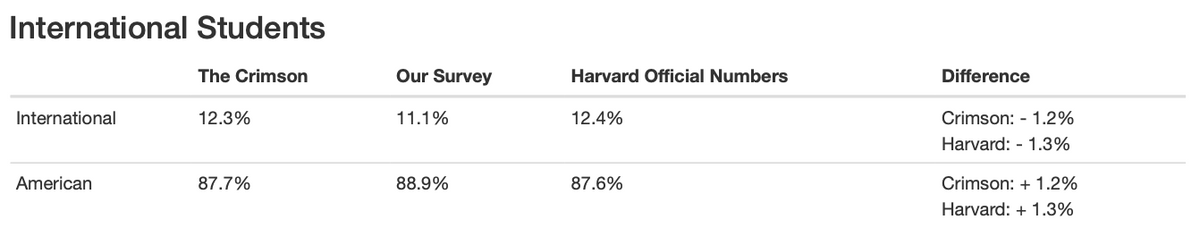 Table 1.4
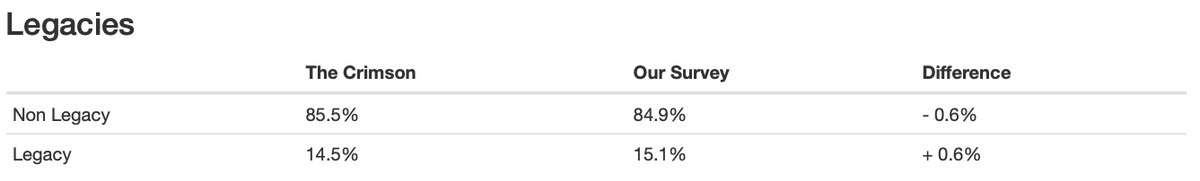 Table 1.5
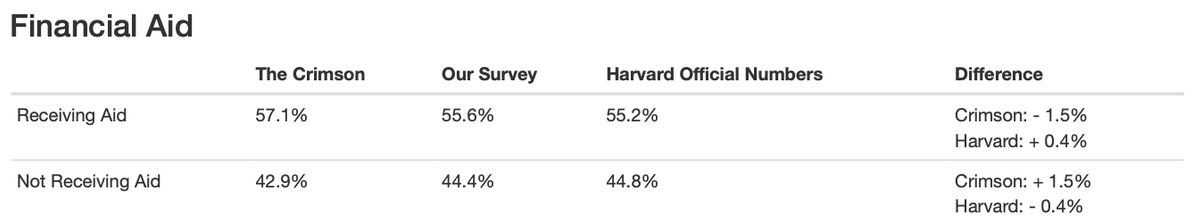 Table 1.6
Results
Are large blocking groups more likely to get Quadded?
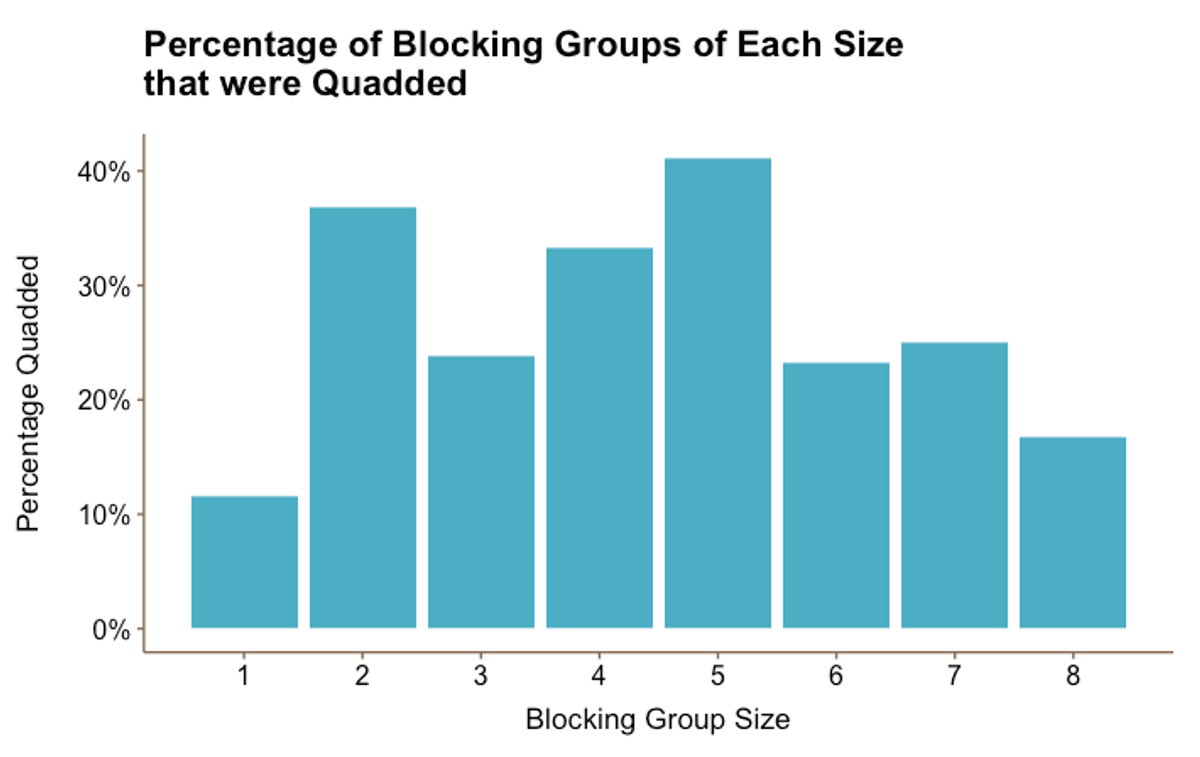 Figure 1
Figure 1 not only shows that larger blocking groups don’t get Quadded more often, but also that there is no consistent relationship between blocking group size and Quad rate. In direct contradiction to popular opinion, blocking groups of size eight have the second lowest Quad rate while the Quad rates for blocking groups of two and five are higher than those of any other size.
Are linked groups more likely to get Quadded?
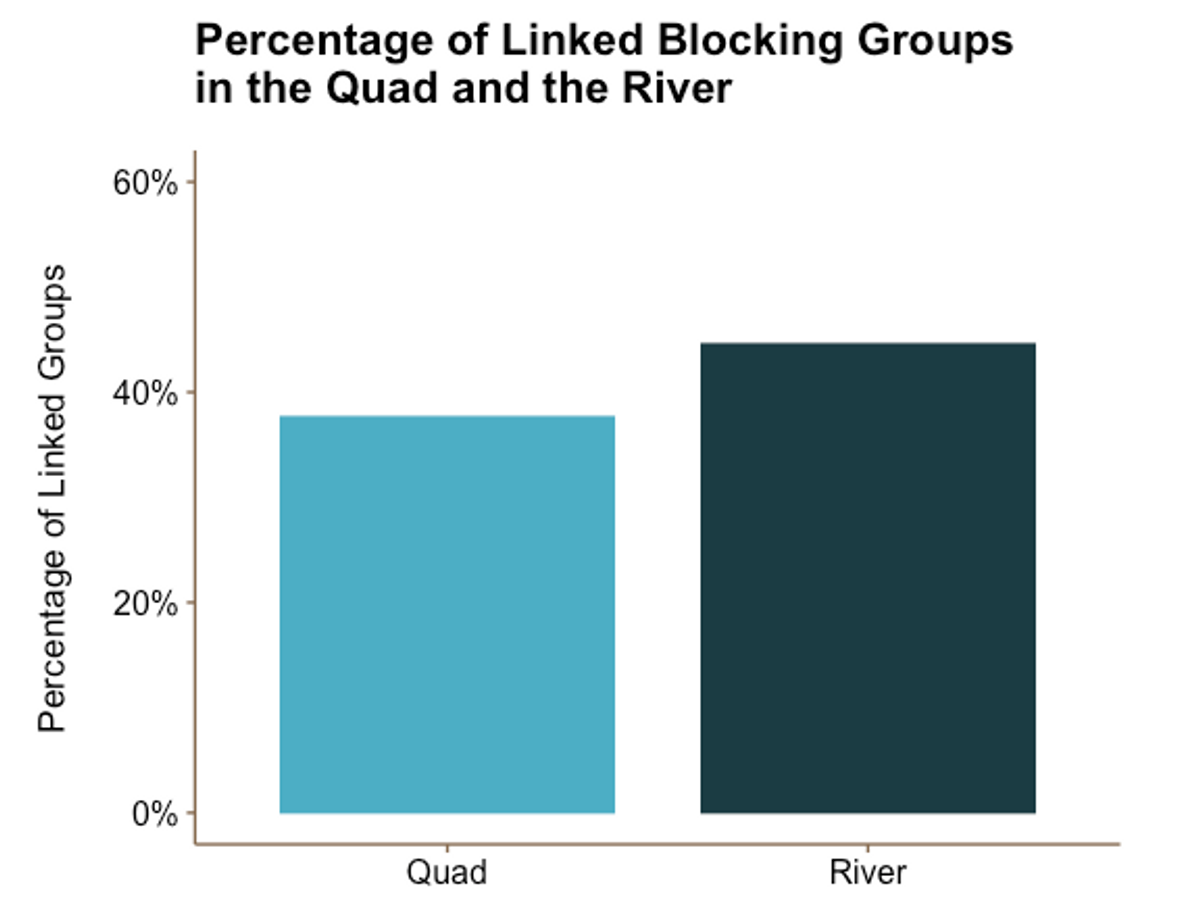 Figure 2.1
Figure 2.1 shows that 45% of blocking groups in the River linked compared to 38% of groups in the Quad. However, it looks like this difference is not statistically significant: when we ran a two-proportion z-test, we found that the proportions of linked groups in the Quad and the River were effectively equal. At a p-value of 0.371, we failed to reject the two-tailed null hypothesis that the observed proportion of linked groups in the Quad is equal to the corresponding proportion in the River. Similarly, at a p-value of 0.186, we failed to reject the one-tailed null that the proportion of linked groups in the Quad is less than the proportion in the River.
So much for the rumour that linking increases a group’s likelihood of being Quadded…
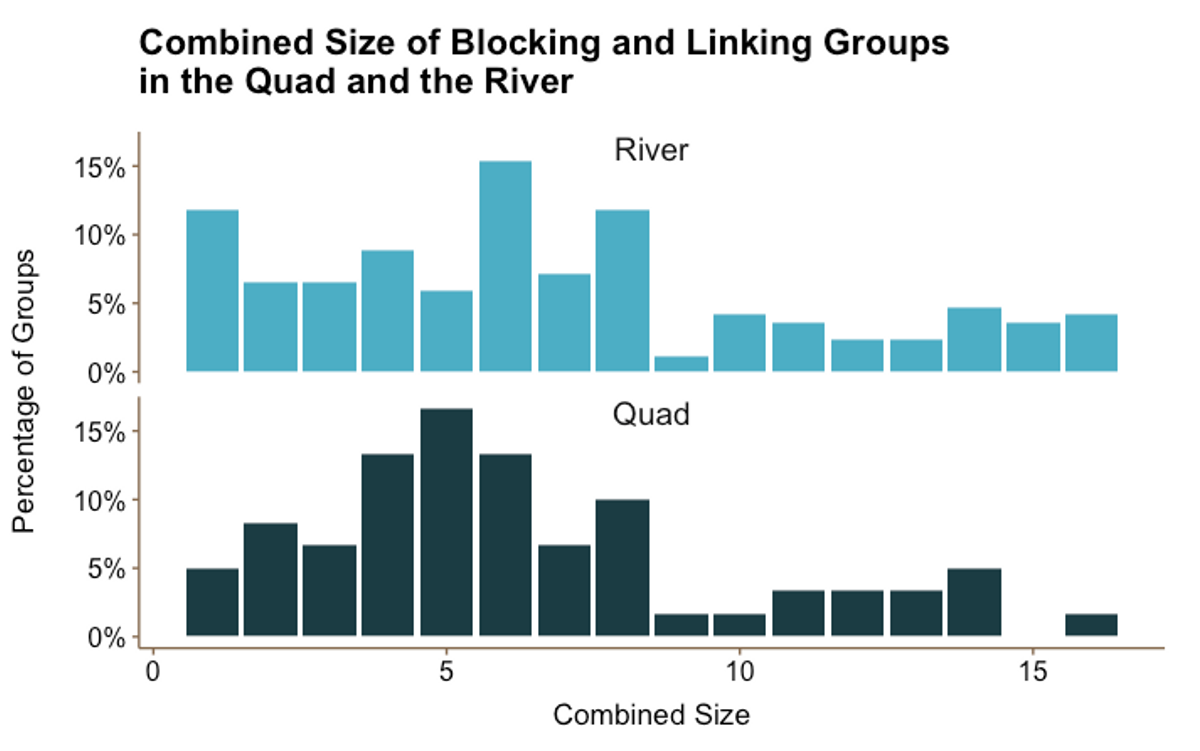 Figure 2.2
Figure 2.2 shows the distribution of total group size (blocking group plus linking group members) in the Quad vs. the River. Most of the larger combined groups (i.e., a total of 15 or 16 members) were assigned a River house, further discrediting the rumour that large linked groups should expect to be Quadded. Interestingly, we also noticed that there is a higher percentage of single person blocking groups in the River even though the Quad is known for its ample supply of singles.
Are certain demographics more likely to get Quadded?
We calculated Quad rates for different demographic groups:
- 21% of athletes vs. 25% of non athletes
- 19% of legacies vs. 27% of non legacies
- 28% of financial aid recipients vs. 24% of students not on aid
- 19% of international students vs. 25% of Americans
Now, the million dollar question: Is Harvard’s housing assignment process truly a lottery? In other words, is it truly random?
We attempted to answer a more specific question: Are the actual Quad rates for certain types of students (athletes, legacies, financial aid recipients, and international students) significantly different from what we’d expect if houses were determined randomly?
We decided to simulate random blocking group assignment and calculate the proportion of athletes (or legacy students, financial aid recipients, etc.) who were Quadded each time to gauge whether our results were distinguishable from chance. When we plotted the frequency of these randomly generated proportions, we saw that some Quad rates for athletes occurred far more often than others. We then plotted the actual Quad rate for athletes on the same distribution to check its consistency with randomly generated results using the following logic: we know that 21% of athletes in the Class of 2022 were Quadded. If we randomly sort blocking groups into the Quad and the River many times, and a large number of these random samples result in 21% of athletes being Quadded, then we cannot conclude that athletes were not Quadded randomly.
In order to implement this approach, we created a function that randomly assigned blocking groups to the Quad or the River. First, we excluded the 146 students whose blocking groups were unknown. Next, we calculated the respective capacities of the Quad and the River by taking the actual number of students who were sorted into each neighborhood, subtracting the spots of students whose blocking groups we didn’t know (remember, we did know their assigned houses), and adding a margin of error to allow very small deviations from the actual distribution of blocking groups. The function started by “packing” the Quad: it randomly assigned blocking groups to the Quad until its capacity was reached and, by default, assigned the remaining groups to the River. Then it calculated the proportion of students from a given demographic group who were Quadded. On the next iteration, the function packed the River, and then continued to alternate between the neighborhoods. For each demographic group, the function went through 10,000 iterations.
Here are the results of our simulations. Note that the red line in each graph represents the actual proportion that was Quadded in 2019.
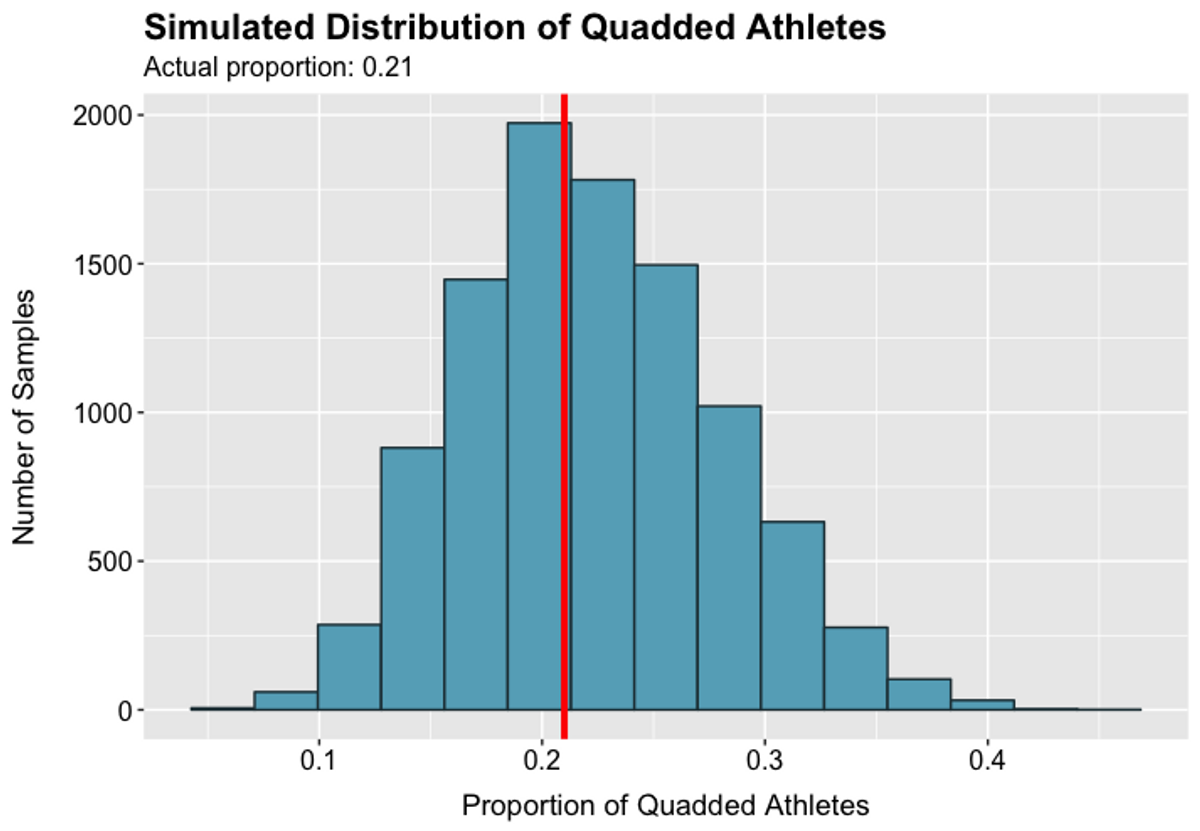 Figure 3.1
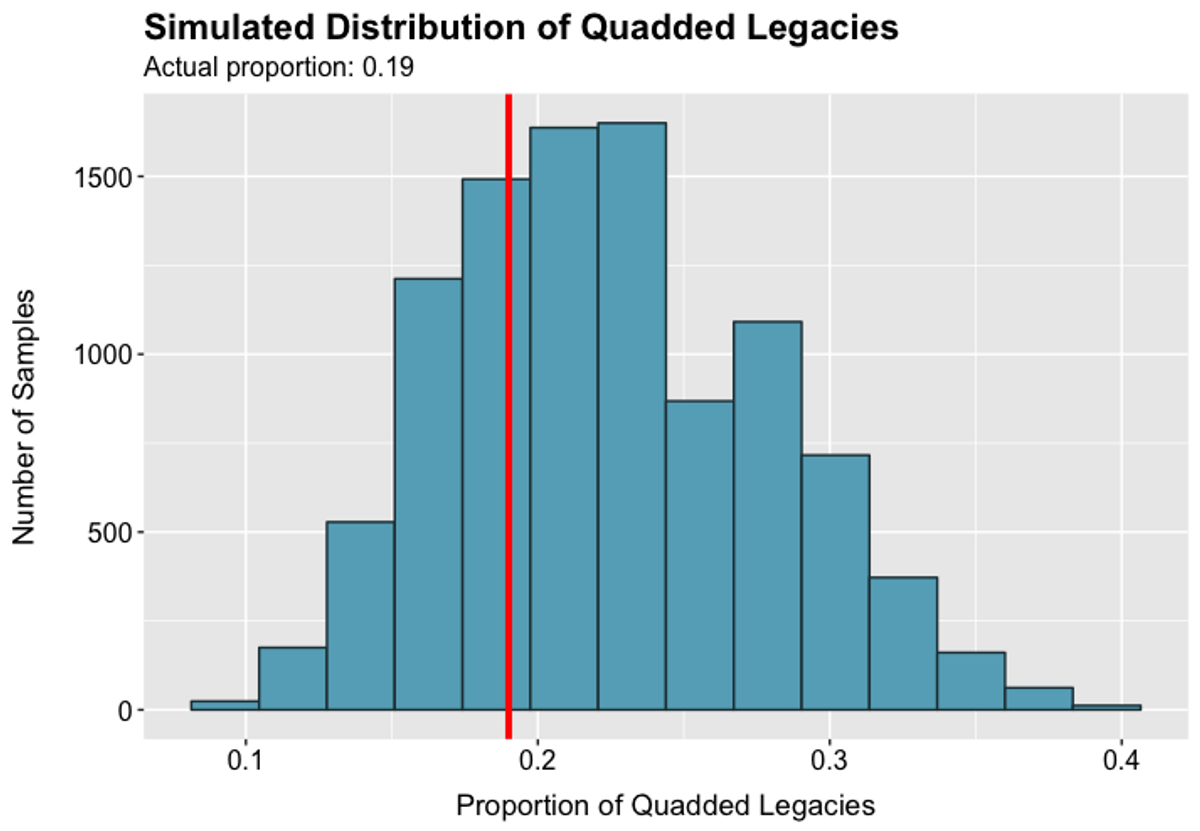 Figure 3.2
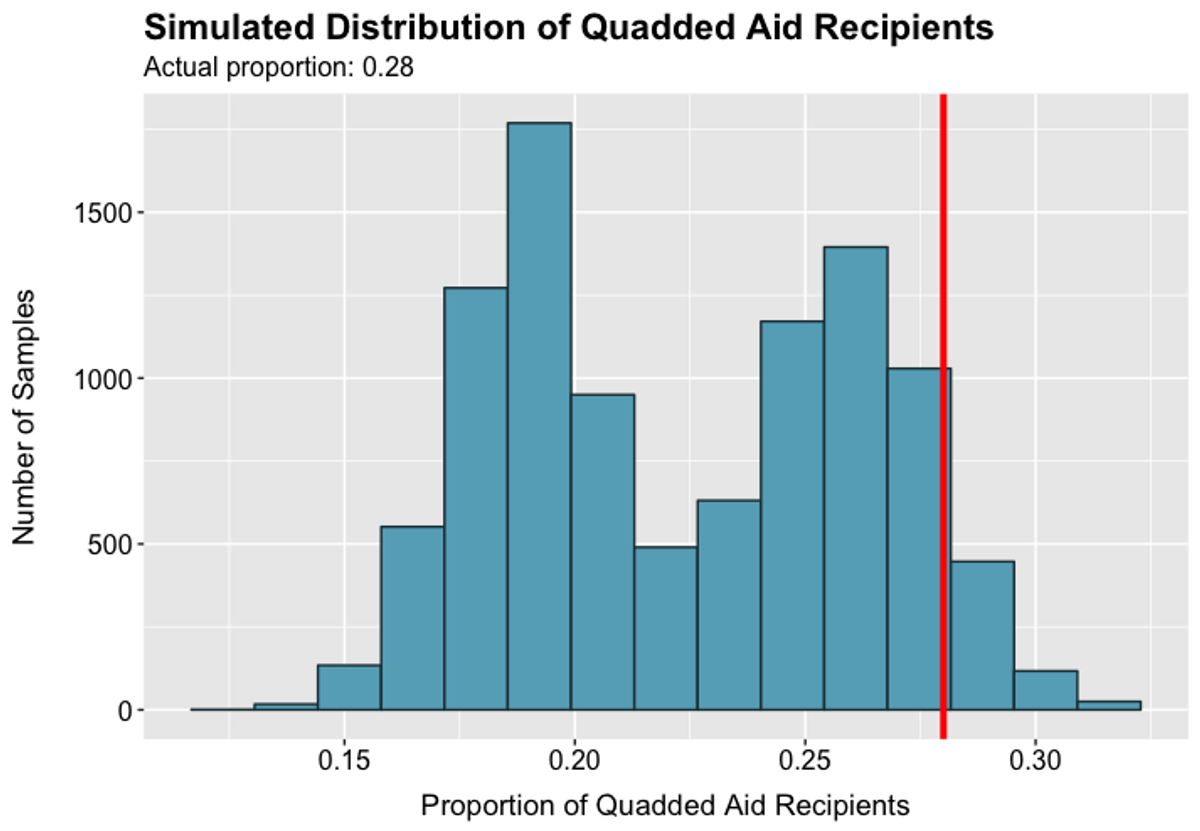 Figure 3.3
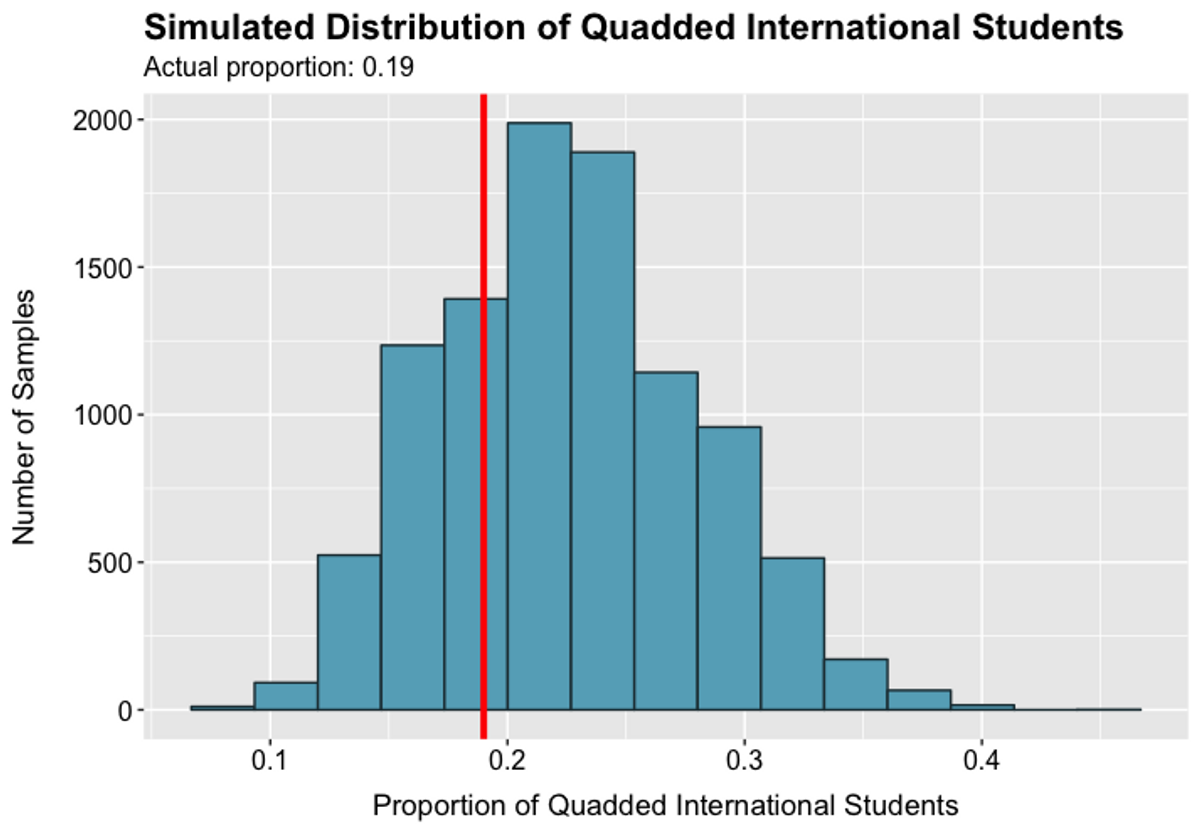 Figure 3.4
Figures 3.1–3.4 show that the actual Quad rates are not significantly different from those likely to occur by chance. As a result, we cannot conclude that Quad rates for various demographic groups are not randomly determined.
Conclusion
Based on our analysis of housing assignments for the Class of 2022, the rumors about large blocking groups and linked groups being Quadded do not hold up. Certain demographic groups were Quadded slightly more often than others; however, this evidence does not support the conclusion that the housing process is not random. It is important to note that the housing assignments in 2019 could have been an outlier relative to other years, either due to random chance or, more likely, due to confounding factors (e.g., Lowell finished renovations). We’d need to collect or obtain access to data from several years to identify historical trends and draw more consistent conclusions about Harvard’s housing assignment process. Ultimately, to ensure transparency and accountability, we call on Harvard’s Office of Student Life and Housing Office to make data about the composition of all upperclassmen houses publicly available.
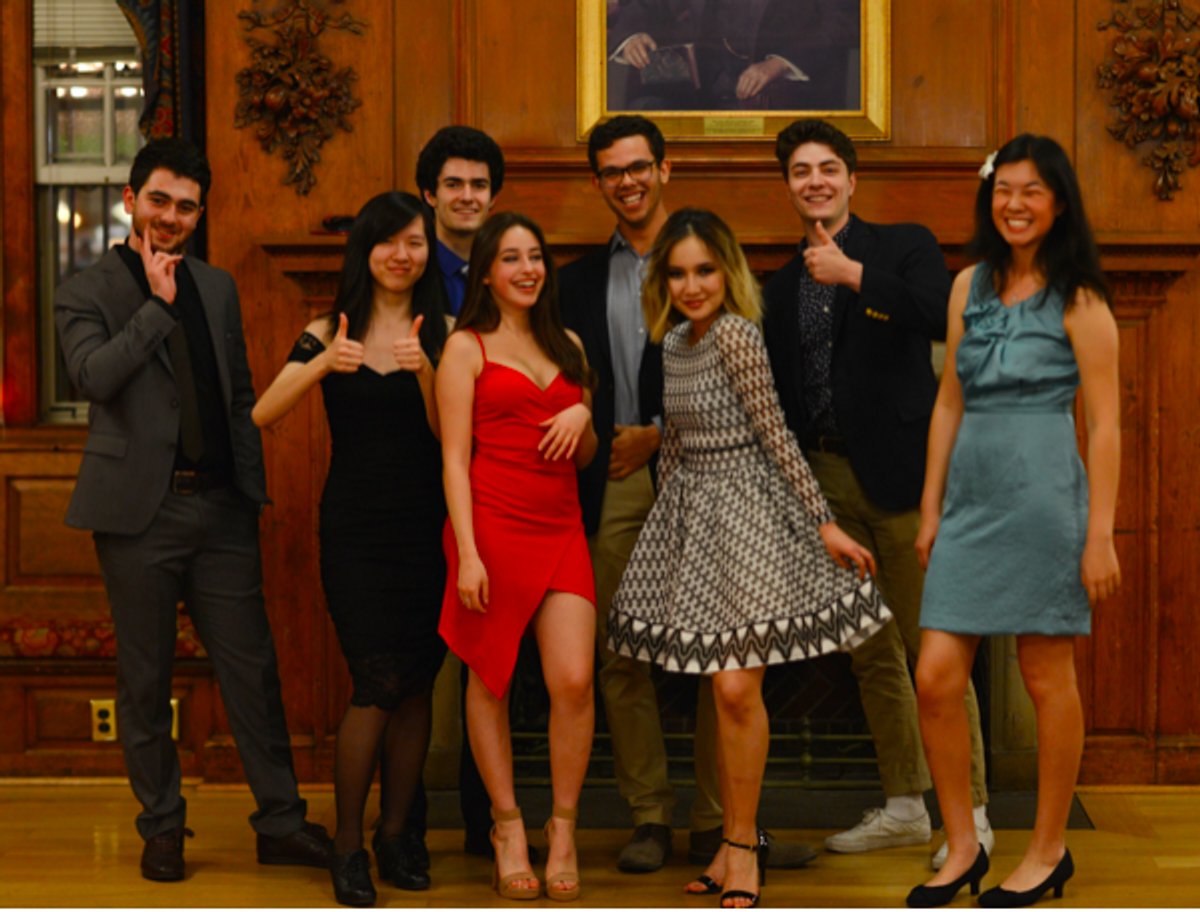 The team of Harvard students that worked on this project. Back, from left to right: Ilkin Bayramli (‘22), Christopher Milne (‘22), Alistair Gluck (‘22), Niel Schrage (‘22). Front, from left to right: Stephanie Yao (‘22), Dasha Metropolitansky (‘22), Adiya Abdilkhay (‘22), April Chen (‘22).