

Have Gym Habits Died After COVID?
How have gym-going habits changed at Harvard after the COVID-19 pandemic?
Introduction
Ask yourself honestly: are you as active as you were before the COVID-19 pandemic? For those who exercised regularly before COVID, the pandemic and lockdown almost certainly threw a wrench in their workout routine. Closures knocked out gyms across the nation, including Harvard’s very own fitness centers. Harvard returned to fully in-person learning for the 2021-22 school year, bringing students back on campus. But are the gyms more packed than ever, or are students avoiding Harvard’s athletic facilities? In this deep dive, we’ll analyze gym habits in the Harvard community and how they changed throughout the pandemic.
The Data
To help answer our questions, Harvard Open Data Project partnered with the Harvard Athletics Department to analyze swipe data from Harvard’s three most popular recreational gyms: the Malkin Athletic Center (MAC), the Hemenway Gymnasium, and the Quadrangle Recreational Athletic Center (QRAC). All data was anonymized to protect individual identities. Our main focus will be on the 2018-2019 and 2021-2022 school years, which we’ll consider “before” and “at the end” of the pandemic. Our dataset is complete for those school years with the small exception of missing swipe data for the QRAC during September 2018. With that said, let’s get to the analysis!
Annual Swipes
We begin by comparing the total annual swipes of each gym before vs. the end of the pandemic. Interestingly, we see a dramatic decrease in usage of the MAC. During the ‘21-’22 school year, the MAC saw more than a 58% decrease in the number of swipes compared to the ‘18-’19 school year. This immediately flags the possibility that students have become less physically active throughout the pandemic. The Hemenway gym also saw a decrease, although not as dramatic, of approximately 11.5%. Interestingly, we see that the QRAC actually saw an increase in swipes of nearly 44%. Accounting for the missing QRAC swipe data for September 2018, we estimate that the QRAC still saw an increase of almost 18%. People may have felt that the less-used QRAC was a safer place to exercise during the pandemic, in contrast to the busier and enclosed underground spaces in the MAC.
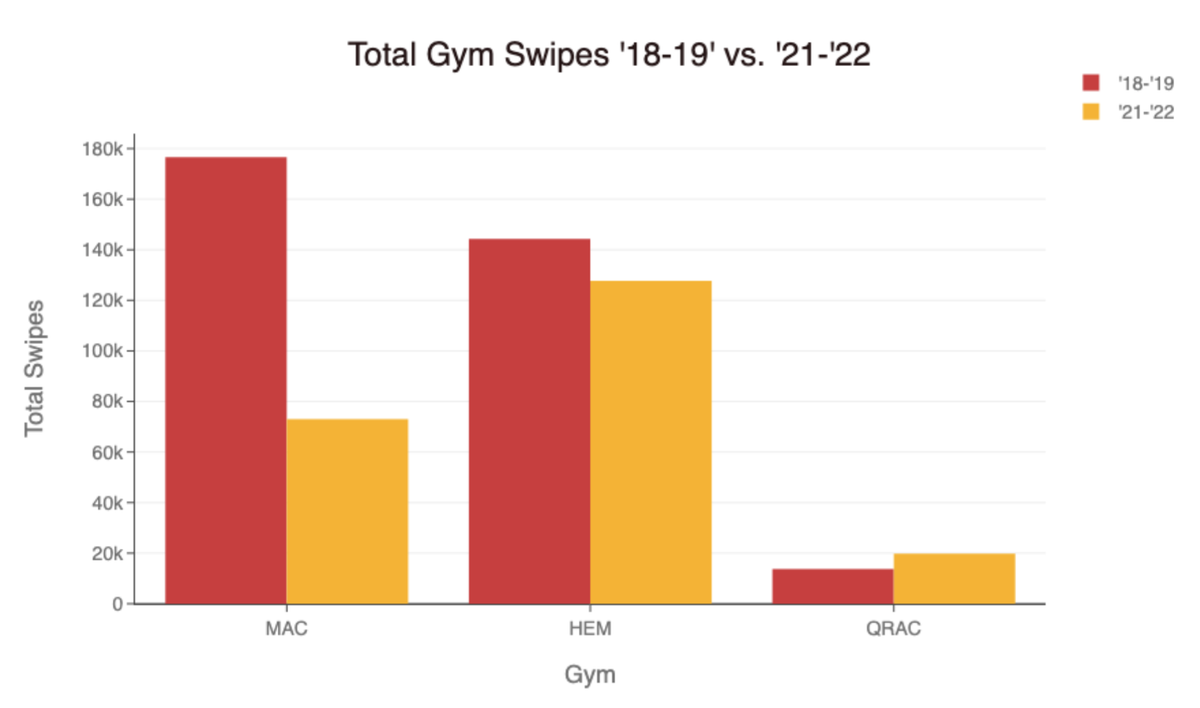 Figure 1: Swipes in 2018-2019 vs. 2021-2022 by Facility
If we combine the results of these three gyms, we see that overall swipes have dropped from around 335,000 annual swipes before the pandemic to less than 221,000. This is likely because the 2021-22 school year was still impacted by the pandemic. Masks were required until March 2022, students were still cautious about spending time indoors, Harvard went remote for the first three weeks of January to control COVID-19 cases, and Hemenway and the QRAC operated with reduced hours due to understaffing. Even so, using swipes across these three gyms as a metric for overall campus fitness, the results suggest that physical activity, as quantified by gym use, in the Harvard community decreased by approximately 34.
Monthly Swipes
If we separate the data into individual months, we see some even more interesting trends.
Across all gyms both before and at the end of the pandemic, it seems like the most popular month for using the gym is February. A combination of revitalization from winter break and New Years’ resolutions may have caused this spike. In general, gym usage peaks bi-annually, at the start of the fall semester in September and the spring semester in February. Gym visits are at their lowest in December and May during finals season and the last few weeks of the semester. Although the numbers of swipes are generally smaller near the end of COVID, the trend of swipes from one month to the next has stayed relatively similar. This suggests that while fewer students are visiting the gym overall, those who do visit are following similar monthly patterns as before the pandemic. The only exception to this is a dramatic drop in gym swipes at Hemenway for the entirety of spring 2019 pre-COVID, most likely because Hemenway was largely closed to students during that time.
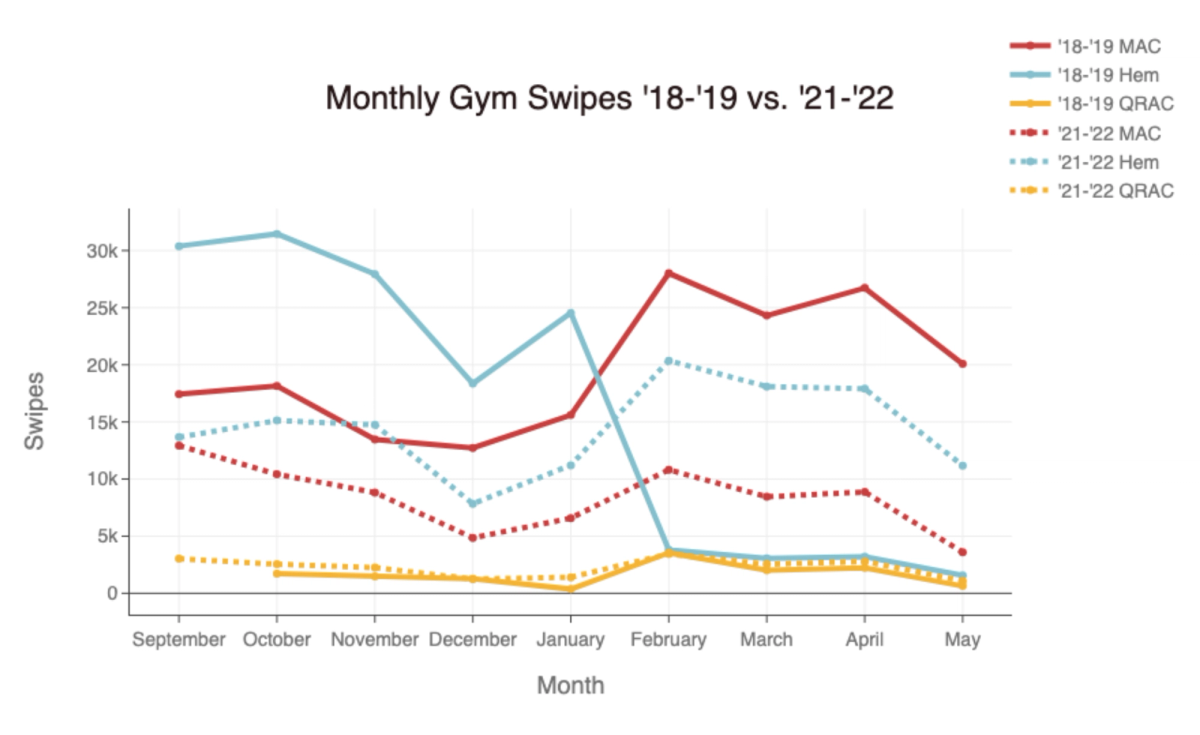 Figure 2: Monthly Swipes by Year and Facility
Popular Days of the Week
We found the most popular day of the week to visit the gym by aggregating the total number of swipes on each day across all three gyms, both before and at the end of the pandemic. The results showed Tuesday as the most popular, with nearly 120,000 total swipes, closely followed by Wednesday and then Monday. At the other end of the spectrum, Saturday and Sunday were the least popular, averaging less than 60,000 swipes, less than half of what was observed in the earlier part of the week. It seems like most gym visitors take at least one weekend day off.
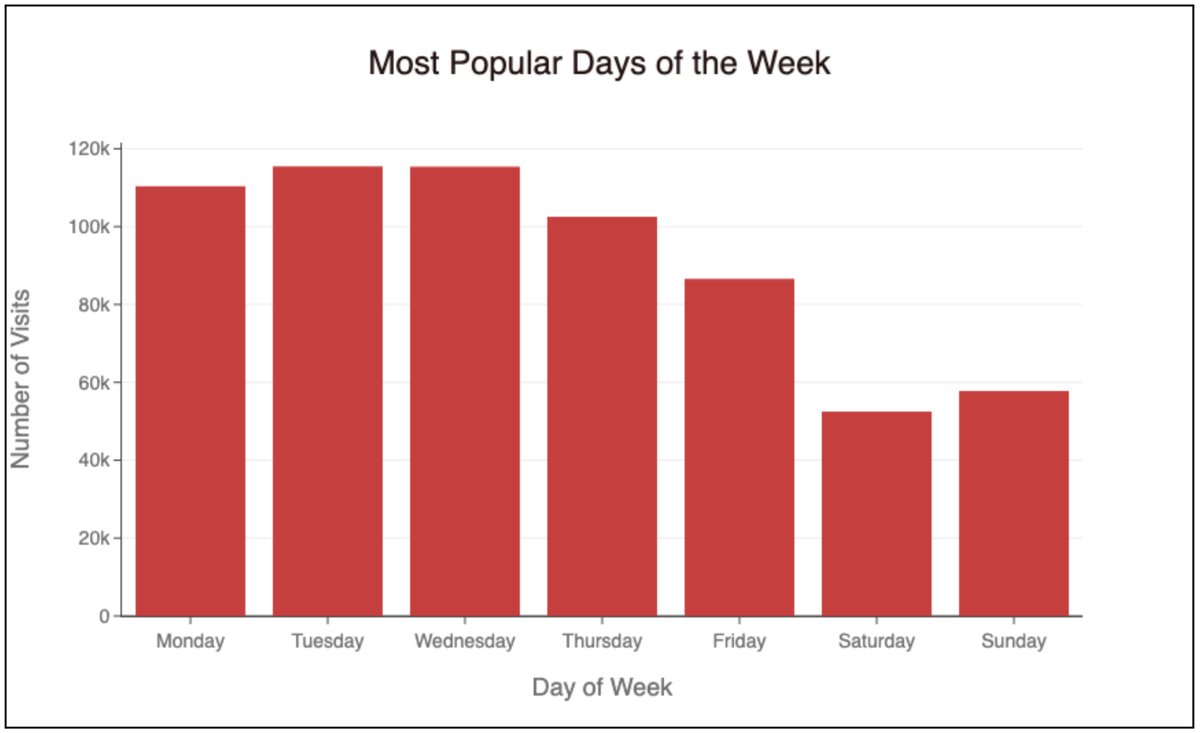 Figure 3: Swipes by Day of Week, Aggregated by Year
Although the number of swipes decreased compared to before the pandemic, the daily usage trends remain exactly the same.
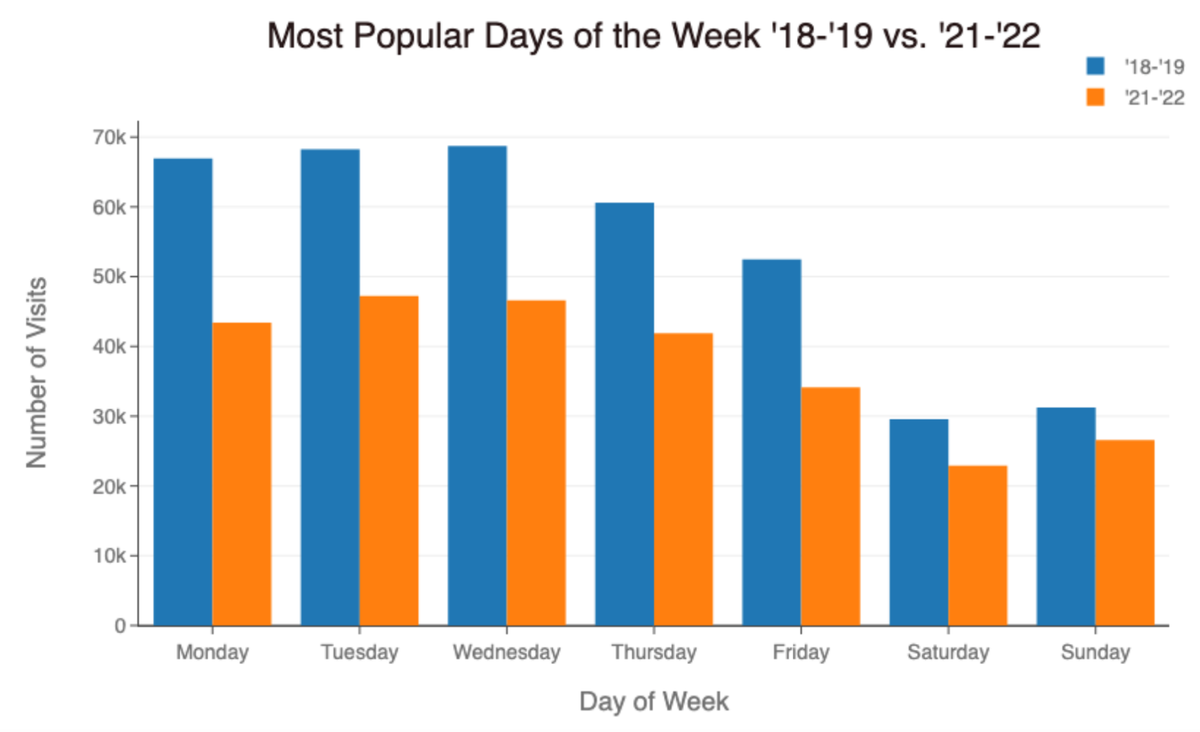 Figure 4: Swipes by Day of Week, 2018-2019 vs. 2021-2022
Additionally, the popularity of each day was similar across all three gyms, with the exception of Sunday being slightly less popular than Saturday at the QRAC. This suggests that no matter what gym students go to, and whether it’s before or at the end of the pandemic, their weekly schedule remains roughly the same.
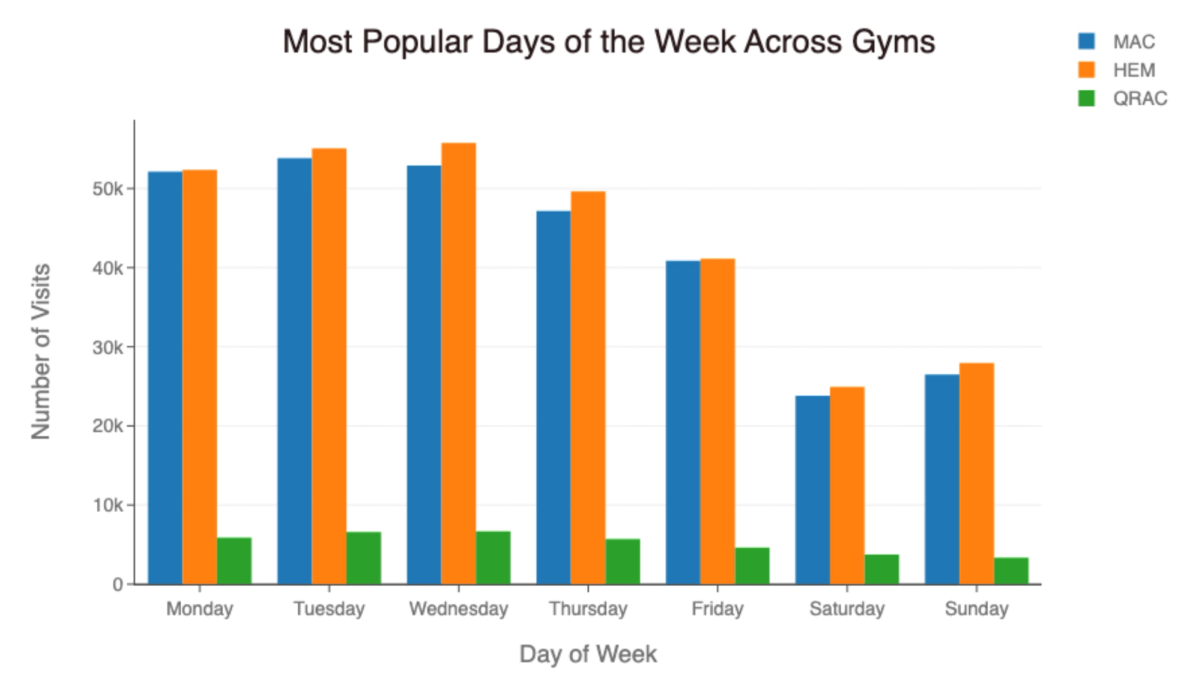 Figure 5: Swipes by Day of Week and Facility
Popular Times of Day
Has the pandemic turned us into night owls? To answer that question, we look at the time of day when people swipe into gyms. In the following graph, we plotted the number of swipes for a given time of day between all three gyms both before and at the end of COVID. In general, we see a huge spike of swipes around 5pm across all the gyms as students and faculty alike get out of classes and fit in a quick workout before dinner time. Before the pandemic, it seems there also used to be a spike around noon at the MAC, but that spike has since disappeared. Instead, ‘21-’22 MAC attendance is more spread out without any noticeable spikes for any particular hour.
 Figure 6: Swipes per Hour by Year and Facility
It’s hard to say exactly how students may have adjusted the timing of their gym visits, so in the next graph we split the times of day into three categories: morning, afternoon, and evening. We defined morning as 5am to 12pm, afternoon as 12pm to 5pm, and evening as anything after 5pm. With this new categorization, it is much easier to see how people’s schedules have shifted. For example, while morning attendance dropped significantly and afternoon attendance remained about the same at Hemenway, evening gym attendance actually increased. Similarly, evening swipes at the QRAC are much higher than any other time of day.
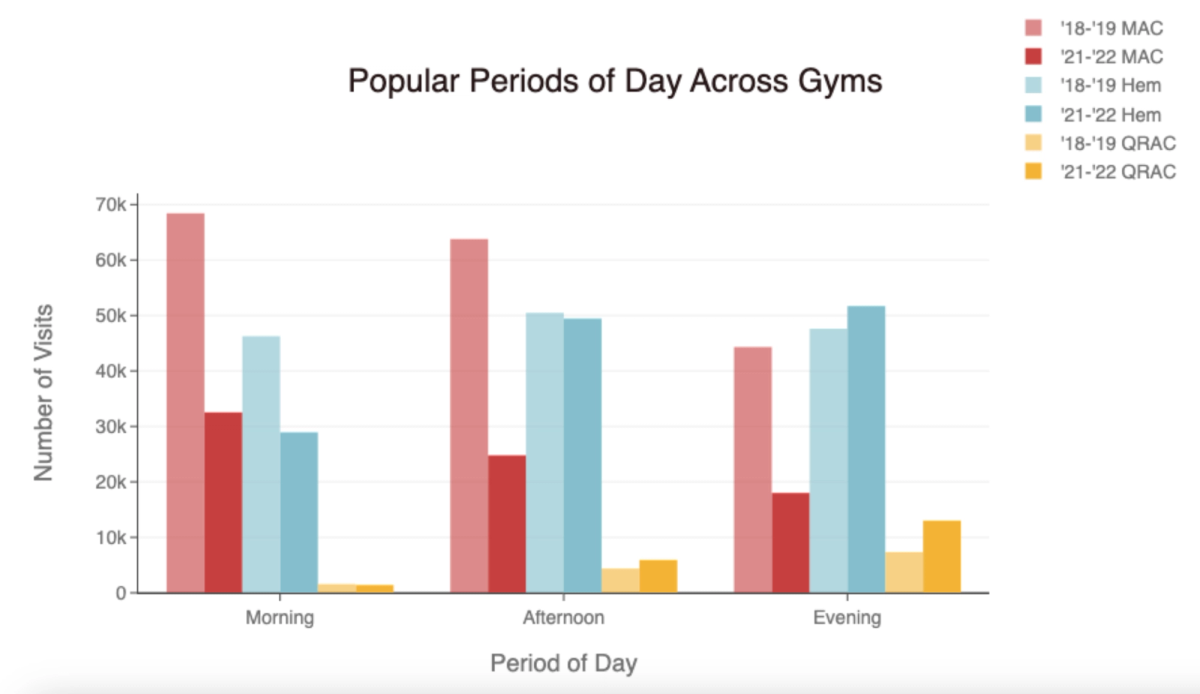 Figure 7: Swipes per Time Frame by Year and Facility
Individual Trends
After examining the general trends at Harvard gyms, we decided to focus on how individuals were using these facilities. In total, there were 20,562 unique gym visitors from ‘18-’19, and 11,464 unique visitors from ‘21-’22, accounting for a grand total of 445,294 swipes across both years studied. Could we identify the fittest Harvard student? There was one individual who used the gym more than anyone else, swiping in 509 times over the entire two-year period. That accounts for 70% of all possible days and 125% of all days students are typically on campus. This individual must have been working out regularly on campus even during school vacation! If it's you, we applaud your admirable consistency!
From ‘18-’19 and ‘21-’22, 8,181 individuals used the gym exactly once. Among those who went to the gym, the mean number of gym visits was 17 and the median was 5, a figure which was roughly the same before and at the end of COVID. When diving deeper into the average number of gym entries per individual, we found that the vast majority of people went fewer than 100 times, with the largest group going five or fewer times. Above 100 gym swipes, the number of individuals dwindles sharply, with just about 100 individuals going more than 200 times, 11 going more than 300 times, and only two individuals swiping in more than 400 times.
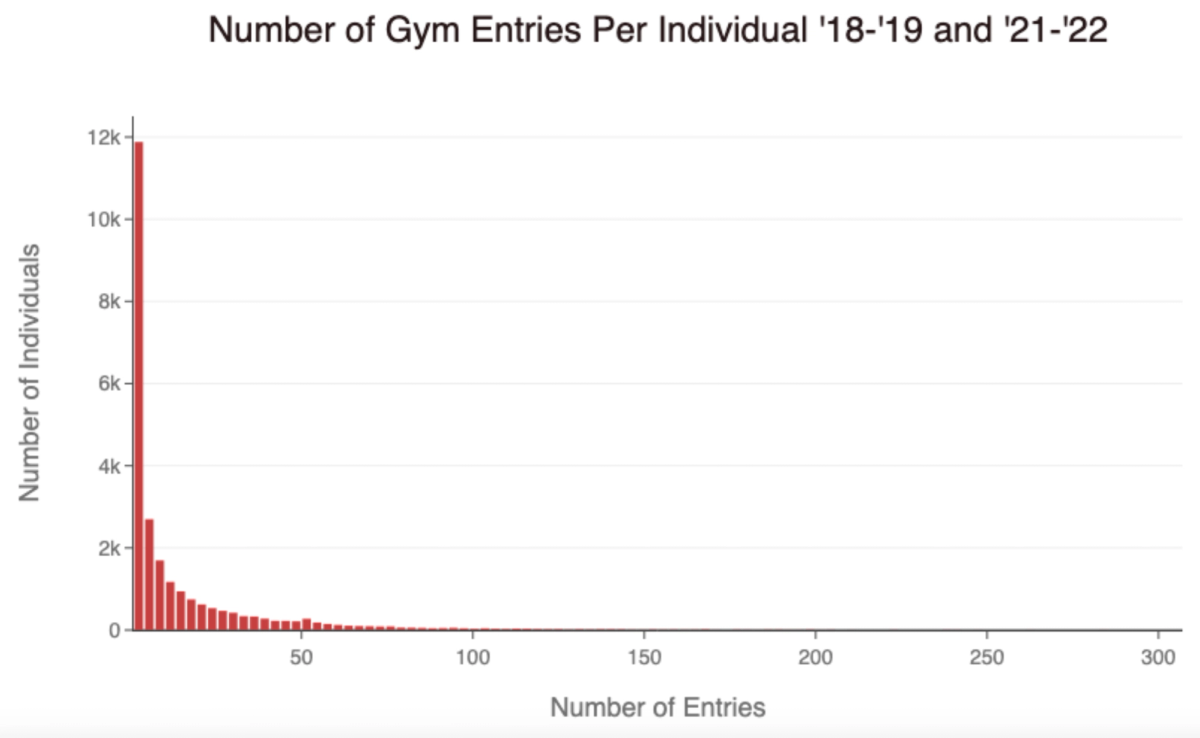 Figure 8: Gym Entries per Individual, Aggregated by Year
Conclusion
The COVID-19 pandemic has had undeniable impacts on gym habits within the Harvard community. Overall, at the end of the pandemic compared to before the pandemic gym attendance was lower, people tended to prefer working out later in the day, and Hemenway was more popular relative to the MAC.
Keep in mind that the ‘21-’22 data used in this study was at the end of the pandemic at a time when many members of the community were wary of indoor exercise, and restrictions such as masking were still in place. Our study does not account for fluctuations in time spent active outdoors, at intramurals, club sports, or house in gyms. In particular, people may have been using house gyms during the school year because they’re smaller and more private. In the future, we’d love to explore gym usage fully post-pandemic using data from the ‘22-’23 school year. We also hope to study data from more of Harvard’s athletic facilities, such as the Murr Center, Blodgett Pool, and Weld Boathouse.
Remember, Harvard offers a plethora of opportunities to stay active. Beyond the gym, club sports and intramurals provide excellent opportunities for exercise throughout the semester. Our hope is that this data helps you to optimize your gym schedule and find the best way for you to work out.