
What Makes a Good Housing Day Video?
How have the popularity, length, and genre of Housing Day videos changed over time?
Introduction
Since the introduction of the random housing lottery in 1995, Harvard first-years have been preoccupied with a singular concern: which of the 12 upperclassmen houses will they be sorted into, and which is the best? Despite knowing they cannot control which residential community they will join, first-years speculate endlessly about food quality, location, and “vibes” as they await Housing Day. This annual tradition brings hundreds of students from across the Harvard community into the center of the Yard on the last Thursday before spring break. Decked in costumes and wielding colorful posters, groups of upperclassmen from each house wake up early on Housing Day morning to “dorm storm” the first-year buildings, shouting and chanting as they excitedly pound on dorm room doors before welcoming first-years into their future houses.
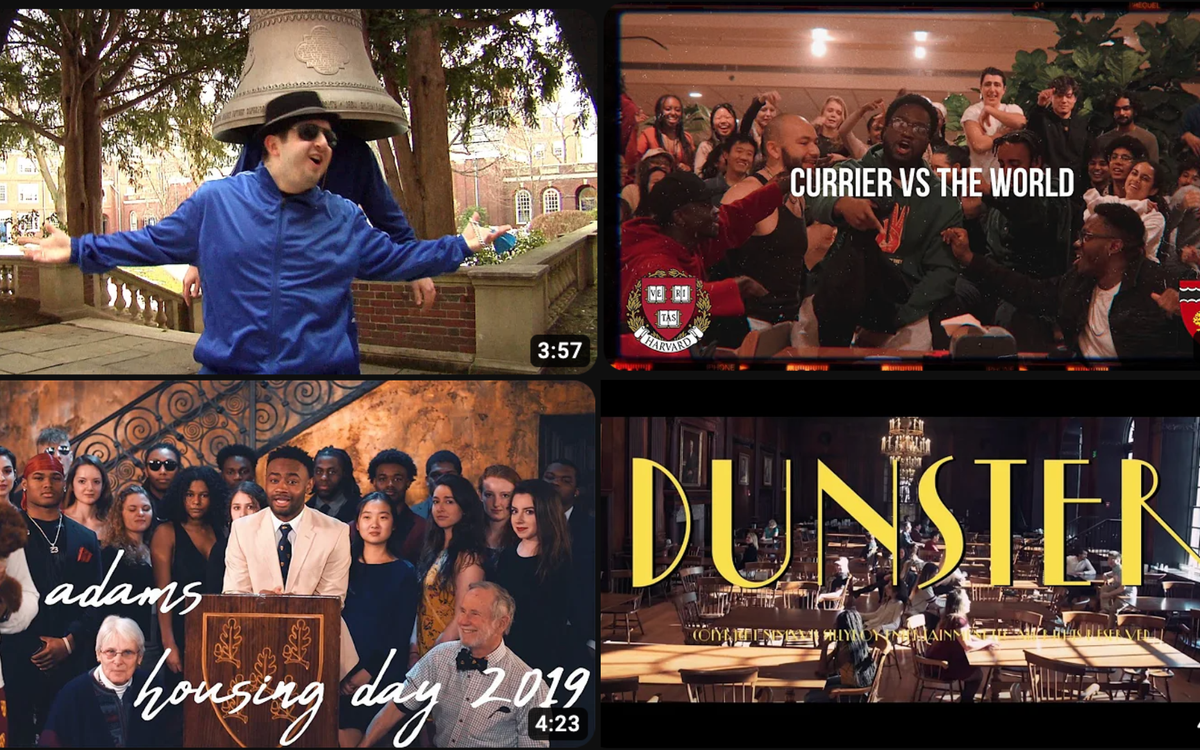
Beginning around 2010, an annual tradition of releasing a YouTube video to promote house spirit emerged among the 12 houses. Released just before Housing Day, these videos not only generate enthusiasm for the morning ahead but also seek to convince first-years why they should want to be placed into each house. Videos range from song parodies to commercials to movie trailers, and all show off the spirit of their respective houses.
Naturally, the question arises of which houses produce the best Housing Day videos and what trends have emerged over the last 13 years. Scraping the publicly available YouTube videos (as of December 2023), we assembled a data frame of various measures of viewing performance, length, genre, and format for each house’s videos.
Which Videos Are Most Popular?
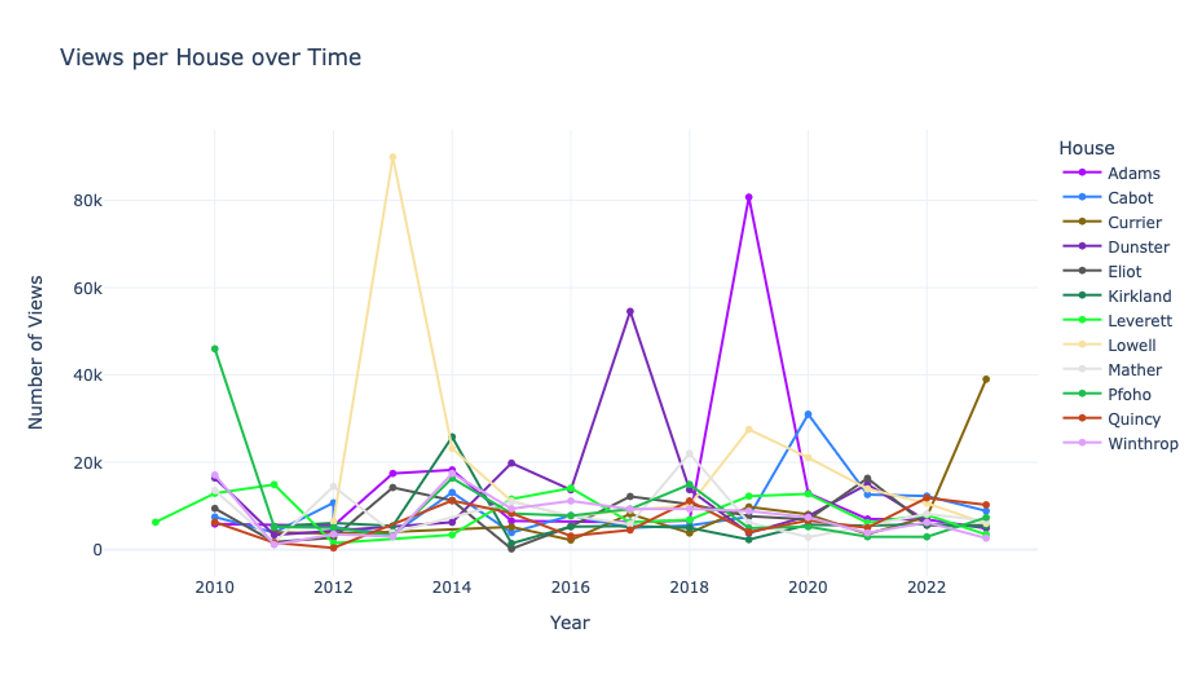 Figure 1: Views per house, 2010-2023.
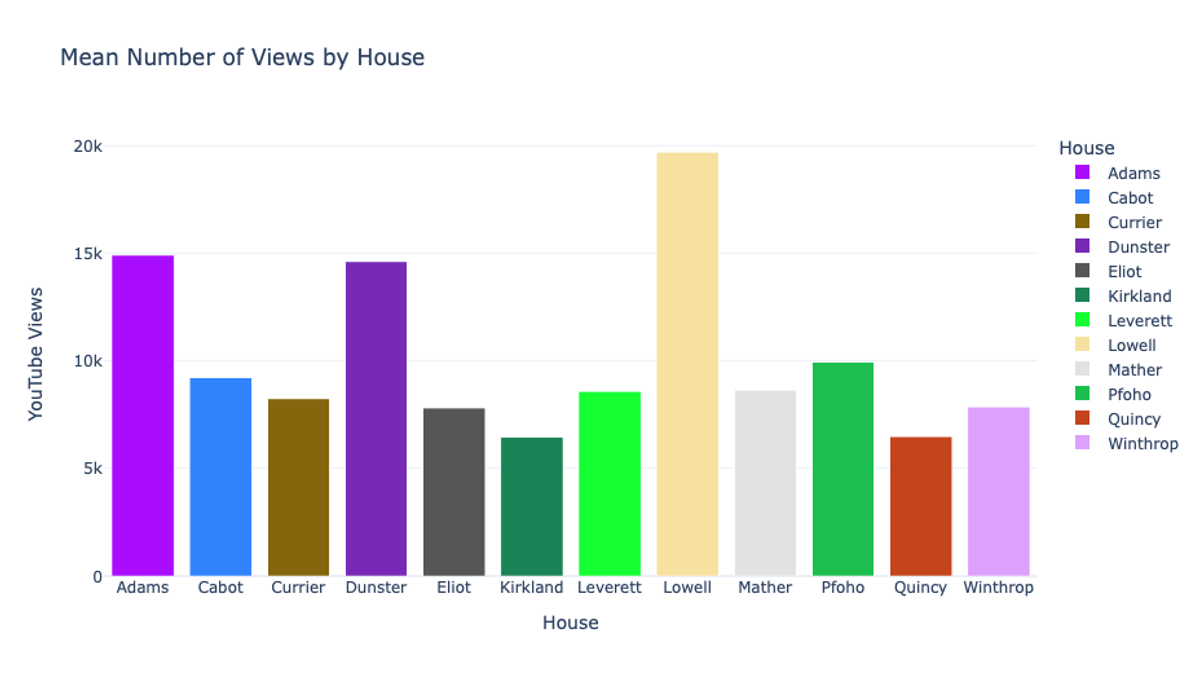 Figure 2: Average number of views by house, 2010-2023.
As seen in figures 1 and 2, the vast majority of housing videos receive fewer than 20,000 views. However, a handful of standout videos have received a disproportionately high number of views over the years, such as Lowell’s 2013 “Get Lowell” video, Adams’s 2019 video, and Dunster’s 2017 “La La Land” video. Not coincidentally, these three houses have the highest mean number of views.
What Types of Videos are Houses Producing?
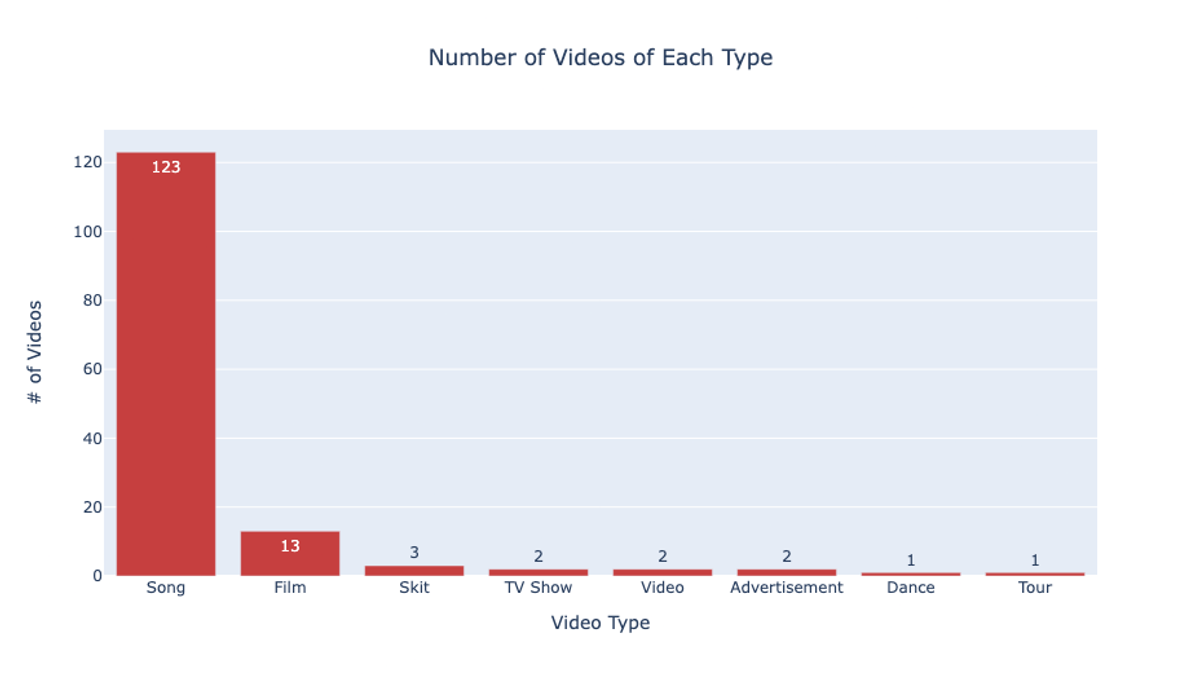 Figure 3: Number of videos of each type, 2010-2023.
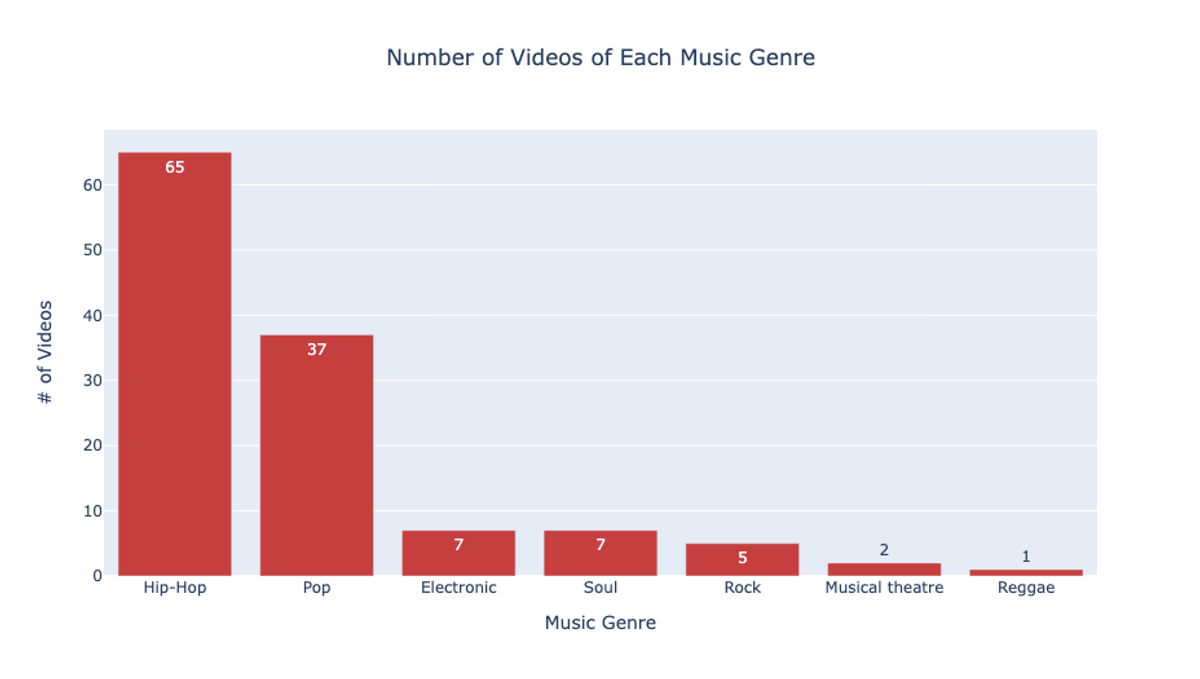 Figure 4: Number of music videos of each genre, 2010-2023.
Houses overwhelmingly produce songs and parody videos, with a general preference for hip-hop. Though other mediums exist — skits, movie trailers, and dances, to name a few — over time, houses have converged around the tried and true tradition of creating music videos.
What Types of Videos are Most Successful?
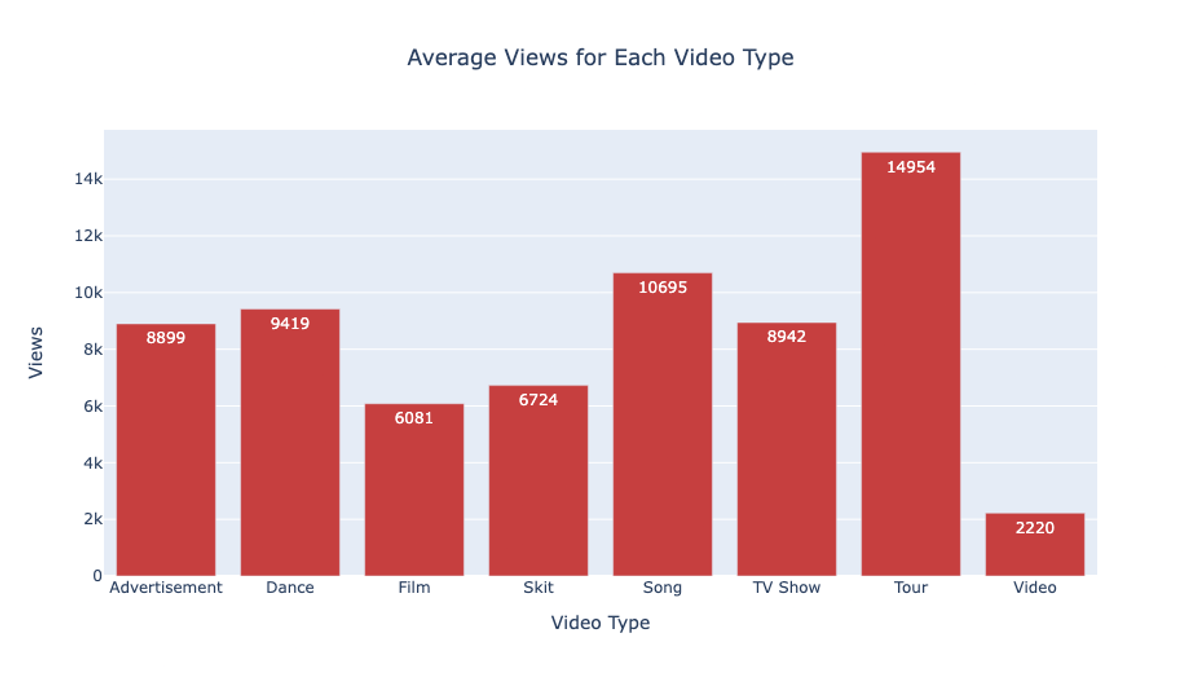 Figure 5: Average number of views by video type, 2010-2023.
To make the most engaging Housing Day video possible and to get first-years excited to join your house, you might want to stick to a type of video that has historically performed well. The average view count for each type of video tends to be around the same, hovering between 6,000 and 15,000 views. The two most common types are songs and films, and while songs tend to be popular, with 11,000 average views, films perform relatively poorly, with an average of 6,000 views. While the tour category was the most popular on average, with almost 15,000 views, this is partly because there was just one tour video.
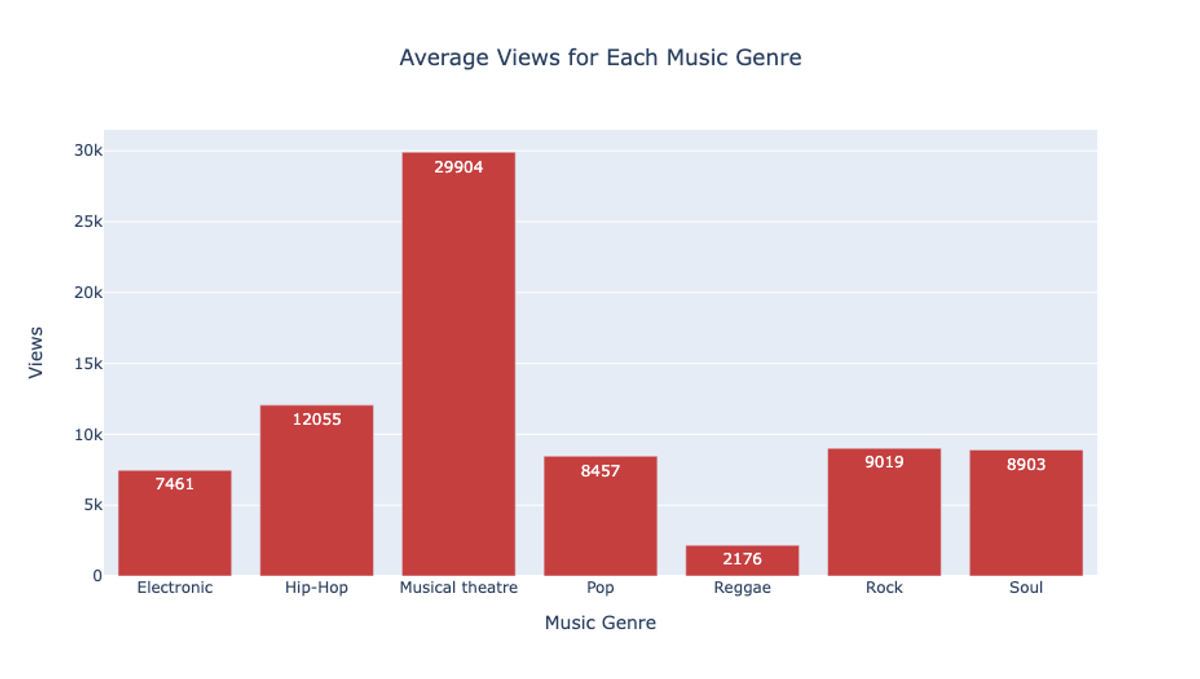 Figure 6: Average number of views by music video genre, 2010-2023.
If you want to follow the longstanding tradition of making music videos, what genre of music should you choose? The most common genres are hip-hop and pop, although the former performs much better, averaging more than 12,000 views compared to around 8,500. For viewers, the most popular music genre is musical theatre, averaging an incredible 30,000 views across the two videos that were made (mostly thanks to Dunster 2017’s La La Land spoof!).
How Have Video Lengths Changed Over Time?
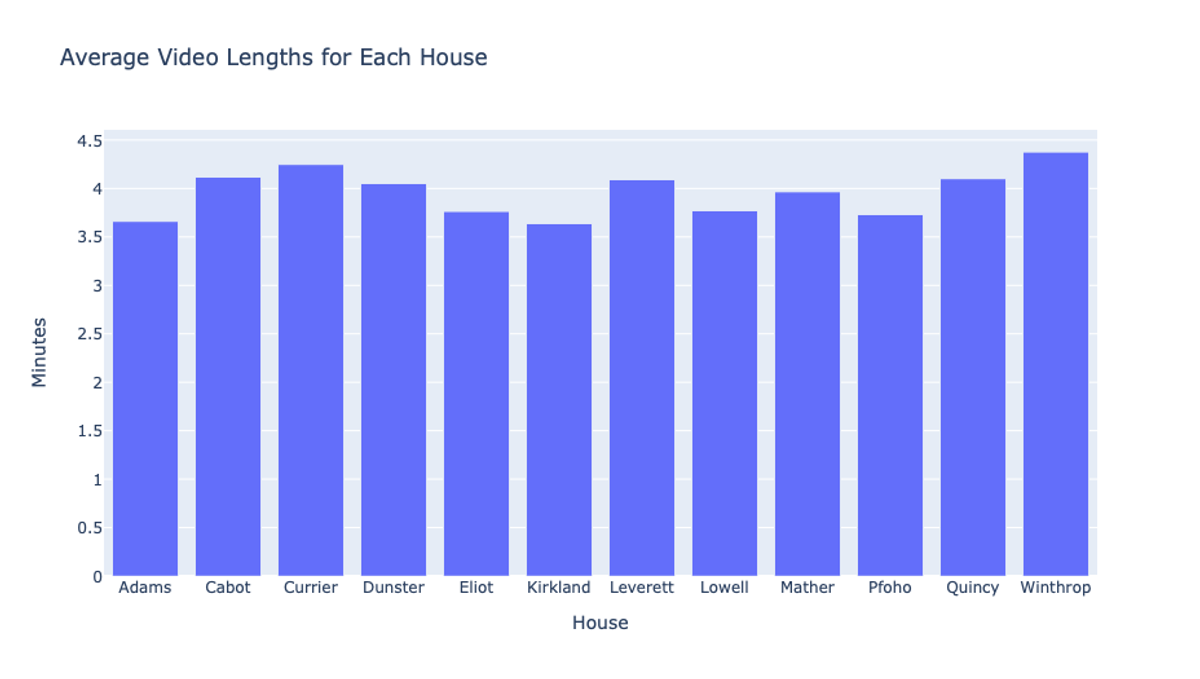 Figure 7: Average length of Housing Day videos by house, 2010-2023.
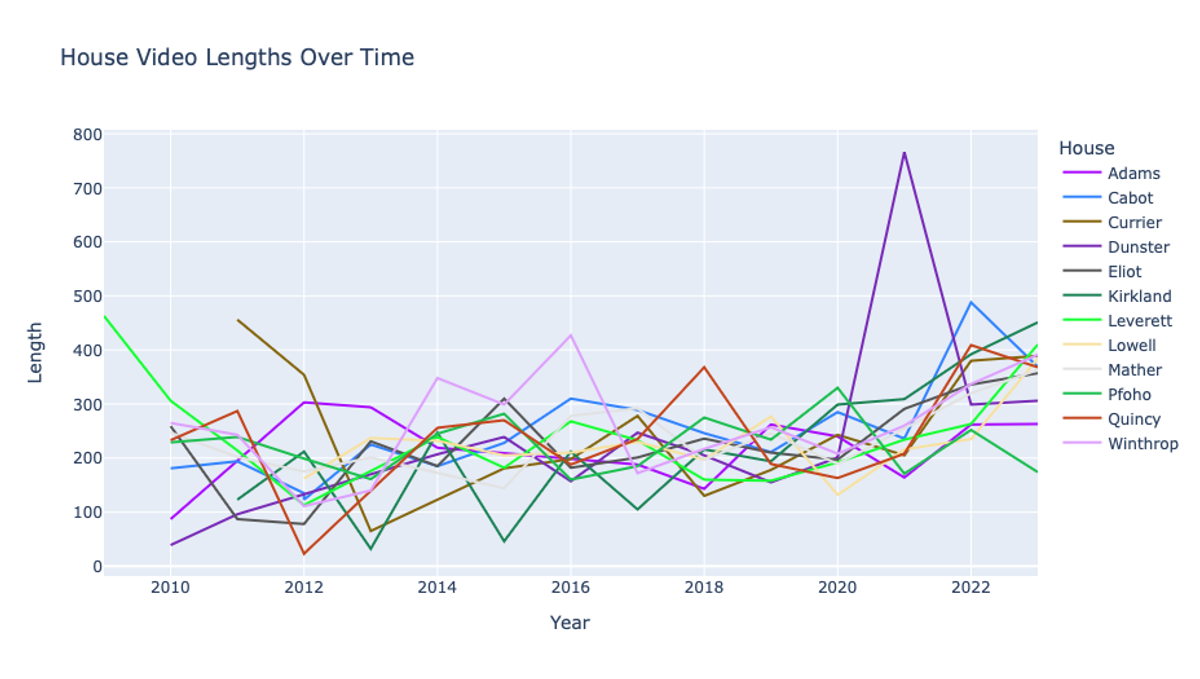 Figure 8: Video lengths by house, 2010-2023
On average, most houses have very similar video lengths, around 3 minutes 40 seconds to 4 minutes 30 seconds long. Winthrop had the longest average video time, with a mean of 4 minutes 23 seconds, while Adams had the shortest average time at 3 minutes 38 seconds. While most Housing Day videos fluctuate around a similar range of times, later years have seen more consistently long videos. Most videos were originally shorter clips, with the lengths of the videos increasing as song and film parodies have become more common. Dunster created one abnormally long video in 2021, which was a tour of the house due to the pandemic.
Equally as important to the quality of the videos is the support of viewers. By tracking the number of comments and the likes-to-views ratio of each video, we were able to calculate the average for each house and estimate which house is most spirited.
Which Houses Receive the Most Interaction on Their Videos?
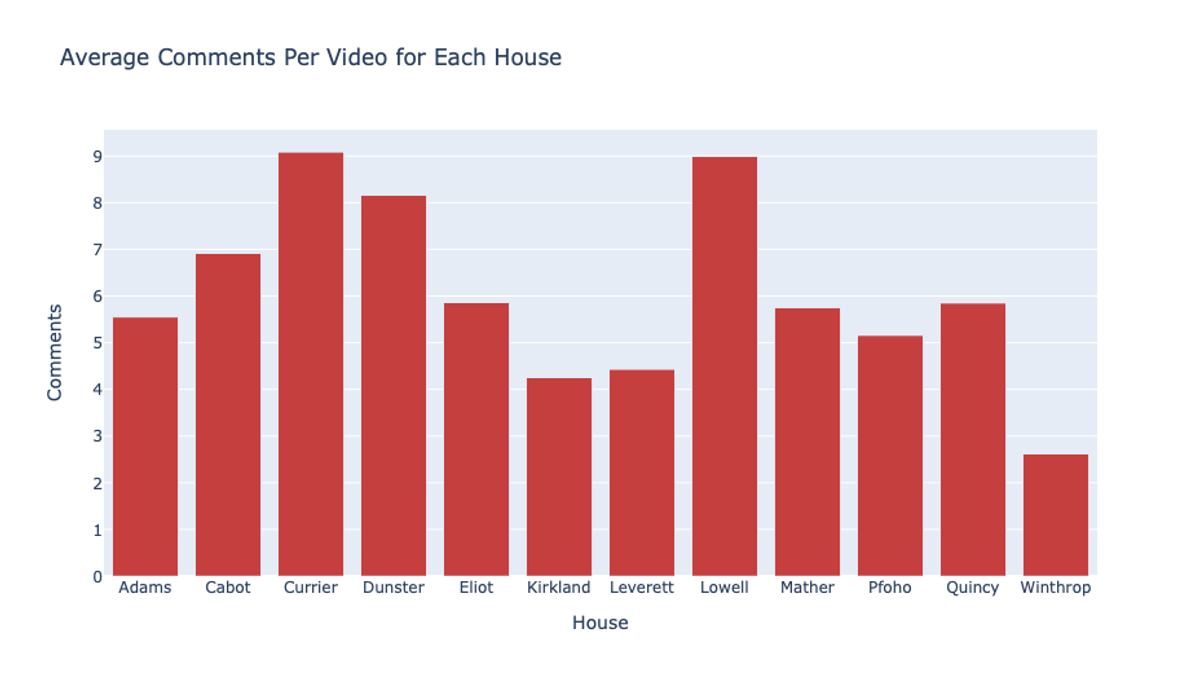 Figure 9: Average number of comments by house, 2010-2023.
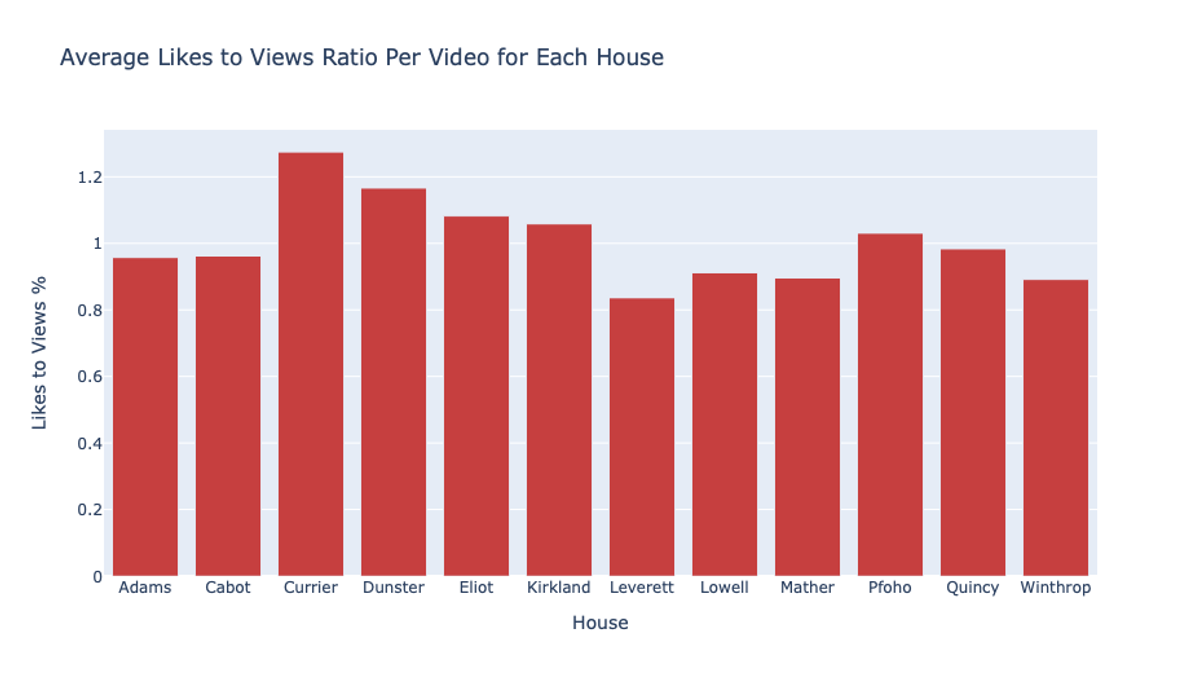 Figure 10: Average likes-to-views ratio by house, 2010-2023.
From these graphs, it is immediately clear that one house stands out, having the highest average in both categories: Currier, with an average of 9.08 comments (closely beating out Lowell with 9) and a mean 1.27% likes-to-views ratio. Perhaps community nights with better food have helped the trees bond together. The range of average comments across houses was much larger, with Winthrop only receiving a mean of 2.62 messages of support through YouTube per year. Every other house usually had at least 4 comments, with an average across the houses of around 6.05 comments. The average likes-to-views ratio did not differ as significantly, with Leverett having the lowest ratio of 0.84%. Given that all the percentages are relatively low compared to YouTube’s general average, clicking the like button on YouTube videos does not seem to be a popular Harvard practice.
What Do the Critics Say?
Every year since 2014, Flyby, The Crimson’s blog, has prepared a “definitive ranking” of that year’s batch of housing videos based on their creativity, polish, and humor. Aggregating this data, we observed that Cabot created the most consistently well-received videos on average, while Kirkland generally fared poorly.
 Figure 11: Average Flyby rank for each house's Housing Day videos, 2014-2023.
Conclusion
While there were a handful of hidden or since-deleted Housing Day videos that we could not evaluate, we were ultimately able to encode the data from over 150 videos spanning back to 2010. Overall, it’s clear that Housing Day videos are a treasured tradition among students that is not going anywhere soon. And, as fun as it is to compare houses and attempt to “objectively” determine which is best — or at least which produces the most compelling videos — the truth is that most upperclassmen find their own house to be the best house.