How Safe Are You At Harvard?
Analyzing types and frequency of crimes on Harvard's campus
In August 2019, a suspected armed man was reported in Harvard Square, leading to prompt response by the Cambridge Police Department and Harvard University Police Department (HUPD). In September 2019, there was a call to report the placements of suspicious packages in the Harvard Square MBTA station. Incidents like these lead to several questions about crime in our area: Just how frequent is it? Are there any trends to the crime happening at Harvard and around the Cambridge area? How can students stay safe? Working in Python, we conducted an extensive analysis of when and what kinds of crimes take place at Harvard.
The HUPD receives hundreds of calls every month. Per its website, the HUPD responds to crimes varying from more heinous “homicide, manslaughter, sex offenses” to more menial tasks such as “investigating suspicious activity, responding to alarms, and investigating trespassers or unwanted guests.” All the tasks are logged in a publicly available PDF on the HUPD website, separated by days (https://www.hupd.harvard.edu/public-police-log).
Previously, Harvard Open Data Project (HODP) members have developed a web scraper to scrape each report from the HUPD website, collecting all the information detailed in each report. Recently, this scraped data was used by HODP to develop a Crime Map detailing the location and type of crime as specified by the police logs. However, apart from the Crime Map visualizing the location and frequency of crime, there has been no analysis of the data set. Since the daily logs were readily available, we decided it would be interesting to analyze the data set and glean any possible insights that we could.
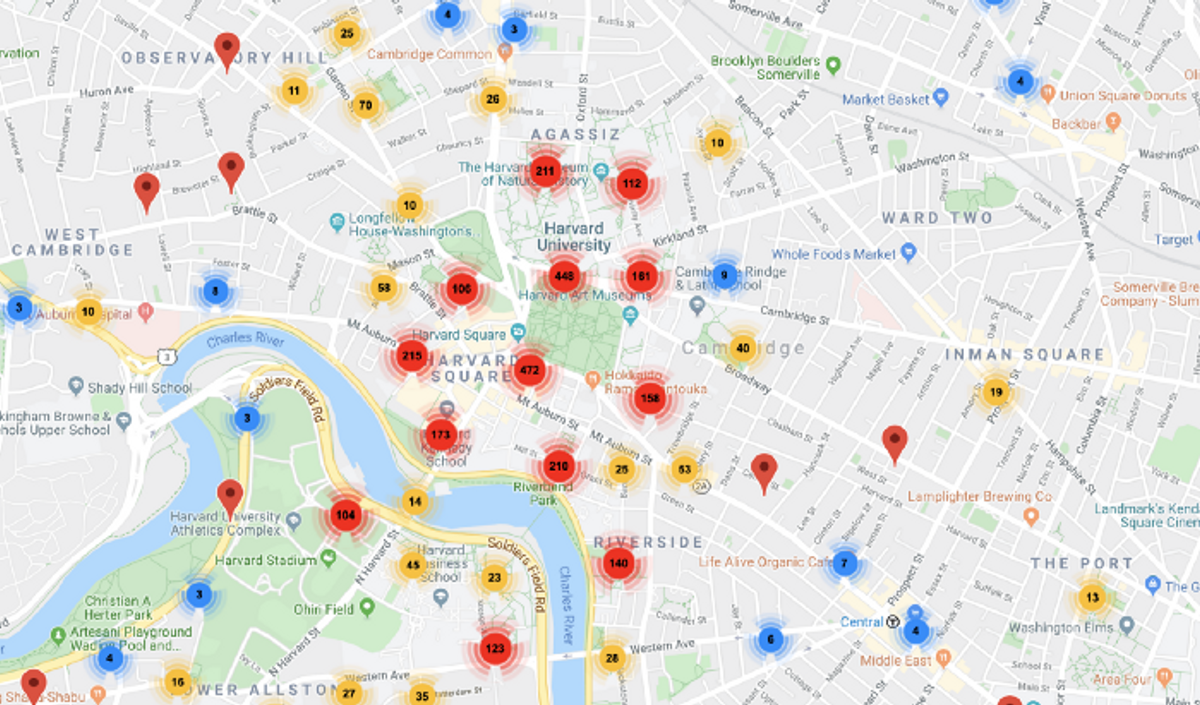 HODP’s Crime Map details the nature and location of local crimes, which it scrapes from HUPD’s website.
Data/Methodology
Our data was extracted from the aforementioned public HUPD records. The records begin on April 1, 2018 and are formatted as individual PDF files for each day. Our data only extends to October 3, 2019, for a total of 537 days and 3378 crimes. The web scraper developed by past HODP members allowed us to convert this data into a Comma Separated Value file. This file stores the date, time, type, location, and police report of each crime. This data was collected from the general Cambridge area around campus as well as parts of Somerville and Boston.
Most Common Types of Crimes
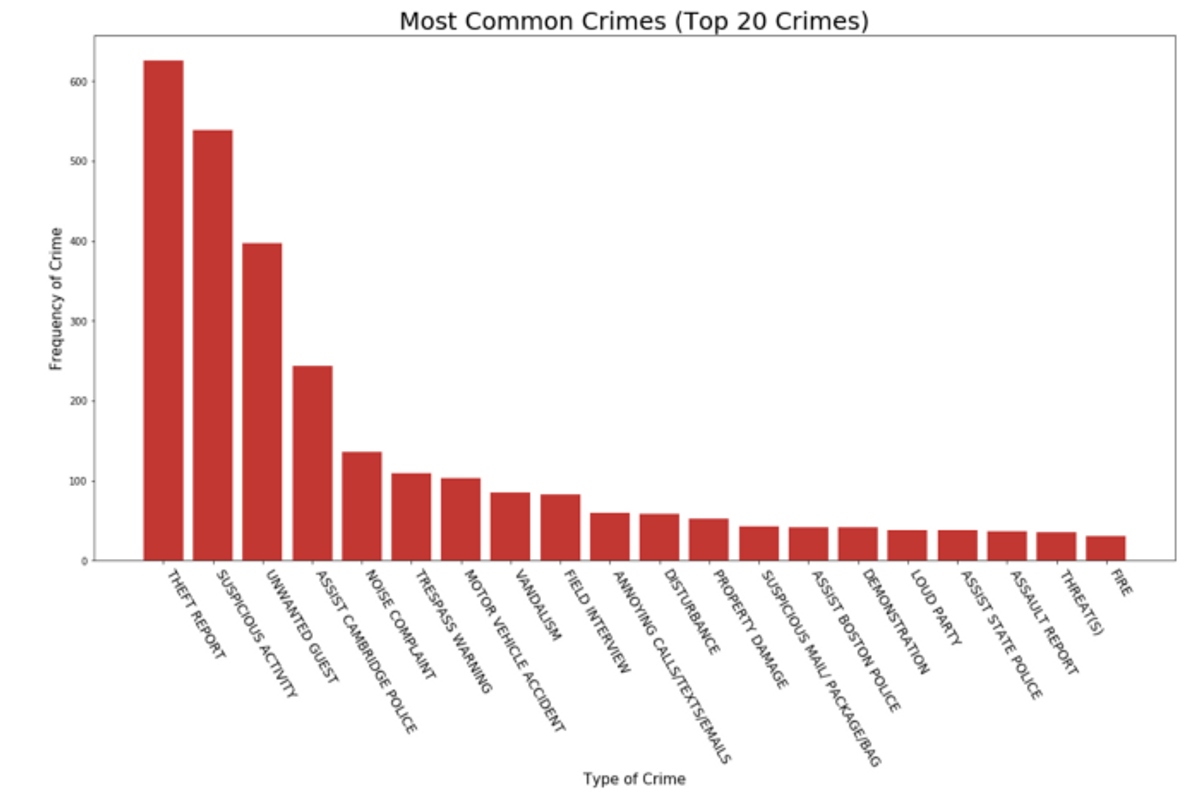 Shown are frequencies of the 20 most common crimes in the campus area as reported by HUPD.
The ten most common crimes were, from most to tenth-most common, (1) theft report, (2) suspicious activity, (3) unwanted guest, (4) assist Cambridge police, (5) noise complaint, (6) trespass warning, (7) motor vehicle accident, (8) field interview, (9) vandalism, and (10) annoying calls, texts or emails. The results of this analysis are not surprising, and in fact, these reports seem very characteristic of any college campus. For a perspective on other colleges and the crime on their respective campuses, take a look at Yale as well as a study conducted by the National Center for Education Statistics. The majority of reports are around small crimes and calls that don’t even result in a crime. Based on this, we can also see that many reports could be related to dorms, since theft, unwanted guests, and noise complaints are all crimes applicable to dorm life. Also, another interesting thing to note is the exponential decrease rather than linear decrease in frequency of crimes. Specifically, common crimes are very common and uncommon crimes are very uncommon.
Crime over Each Hour of the Day
When analyzing the number of crimes that occur over each hour of the day, a few notable trends were discovered. First, the percentage of crimes reported was highest between 11:00 AM and 4:00 PM, which was to be expected as these are usually the hours when people are most active during the day.
The percentage of crimes reported was lowest between 1:00 AM and 6:00 AM, which was also to be expected as these are the hours when people are usually asleep and so aren’t committing/reporting crimes.
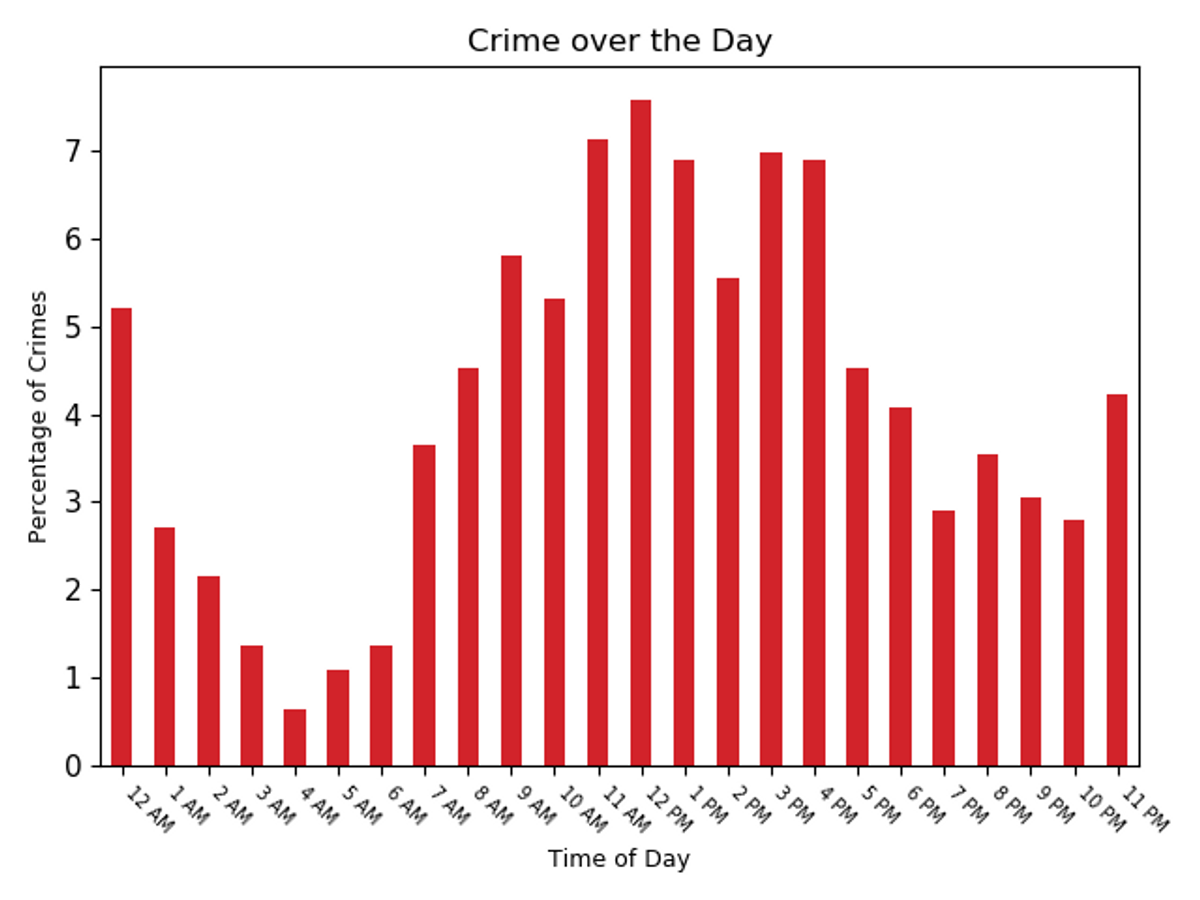 Crimes were most frequently reported around midday with another uptick around midnight.
Crimes Committed over Each Day of the Week
Inspecting the frequency of crimes reported over each day of the week, Monday, Tuesday, Wednesday, and Thursday seemed to stay at similar levels with around 15% of crimes being reported on each of those days with Friday having the highest share of crimes reported with close to 17.5%. Meanwhile, Saturday and Sunday had the lowest percentage of crimes reported at around 11% and 10% respectively.
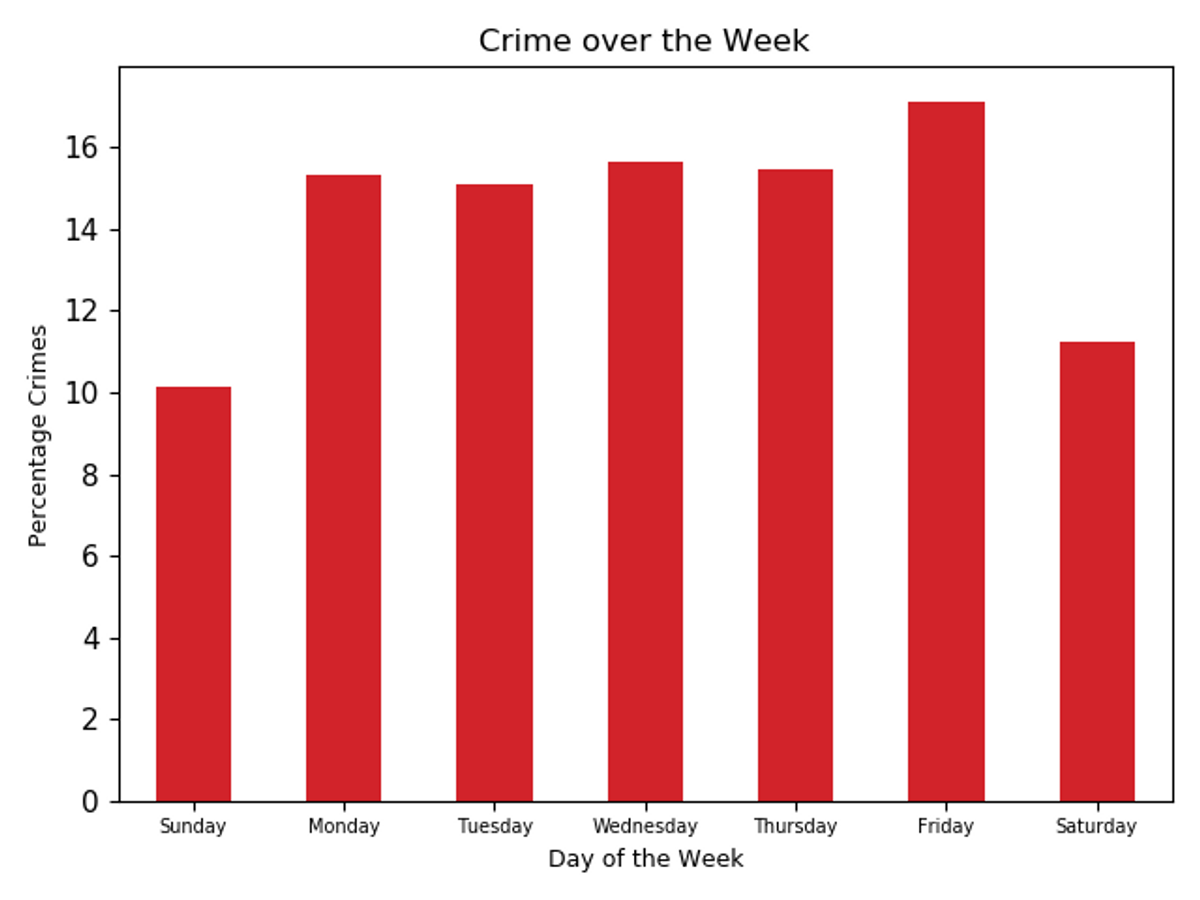 Crime reporting rates were relatively stable by day, with a small spike on Fridays and lull on weekends.
Crime Over the Year
Analyzing crime across the entire year, there are some trends that we can similarly deduce.
This seems to correspond most closely with when students are around. When students are on campus, crime rises. When students are on break, crime drops. While this would typically indicate that the presence of students is causing the rise in crime (i.e. students aren’t committing crimes) our previous analysis indicates that this isn’t the case. What are more likely explanations are that because there are more people in the city of cambridge, there are more potential victims of crime. Also, with more people on campus, there is an increased likelihood that crimes are reported. Finally, it may simply be the weather that influences would-be criminals and their propensity for crime.
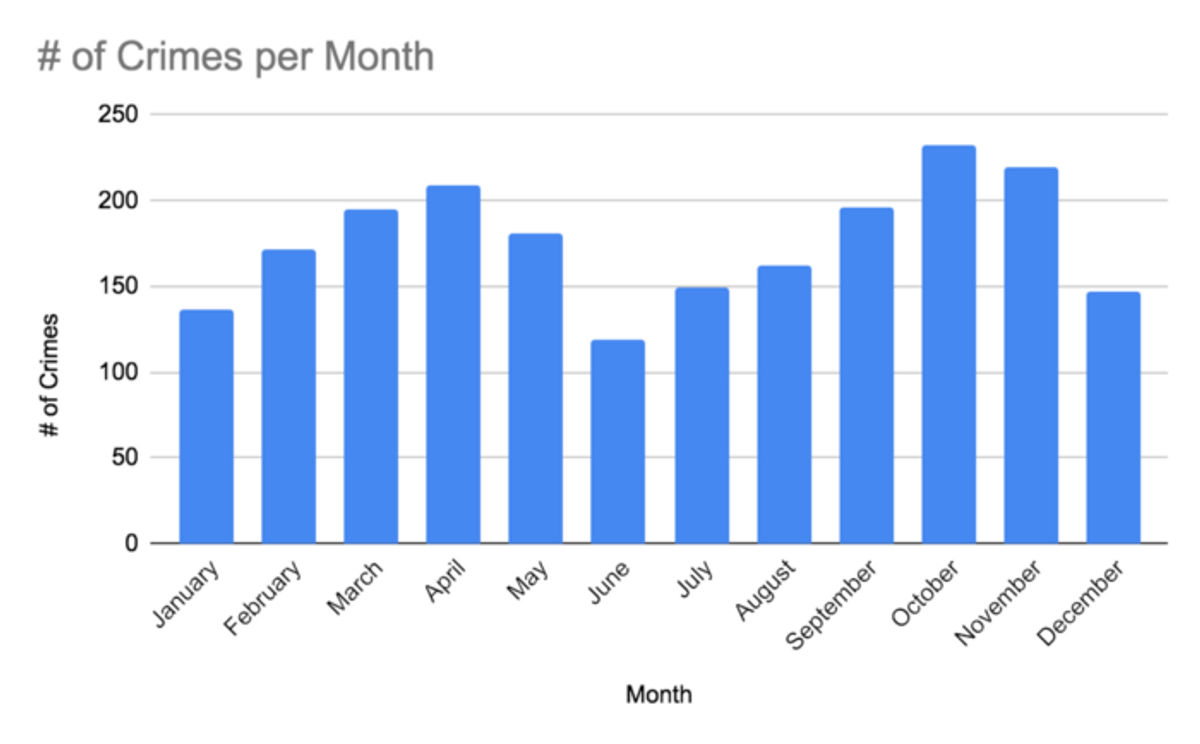 Crime around campus rises in the spring and fall and dip in the summer and winter.
Conclusion
Altogether, crime around Harvard is not out of the ordinary, or at least it seems that way based off of HUPD reporting. The crime trends are very characteristic of a college campus with crime coming and going with the flow of students and people, or perhaps the weather. Hopefully, crime continues to decline on a whole and we can all feel a little safer around campus; until then, however, make sure to keep an especially close eye on your wallets on Fridays in October at noon.
