Deep Dive: Crime in Boston
Just how dangerous is Boston, really?
Introduction
In this project, we aimed to analyze how the crime rate varies in the area surrounding Harvard, looking specifically into the 24 neighborhoods that comprise the city of Boston. Using data reported publicly by the Boston Police Department, we mapped how crime varies by neighborhood, year, month, and hour.
Analyzing crime rate variations in different neighborhoods is crucial for effective resource allocation and targeted policing strategies. By understanding crime patterns over time and by location, Boston law enforcement officers can identify areas of concern and make plans to address underlying situational and socioeconomic factors that contribute to criminal activity. This analysis helps improve community safety and well-being by informing the timing of law enforcement initiatives and the allocation of resources to areas with the greatest need.
Methodology
Working in Python, we conducted an extensive analysis of what kinds of crimes take place in Boston and when. Accessing the Boston Police Incidents data via API, we narrowed our output fields to crime, zip code, district, premise (area where the crime was committed), weapon description, year, quarter, month, neighborhood, offense description, hour of day, and day of week. After a preliminary analysis of the data, we decided to narrow our areas of analysis to neighborhood, year, month, and hour.
However, we quickly discovered that despite the website reporting that the data includes daily records created after January 1, 2018, the data only included 1 entry for 2019, 6 entries for 2020, 15 entries for 2021, and 1,976 entries for 2022, with 0 entries for the remaining years between 2018 and 2024. This seems to be a significant discrepancy in the way data is labeled on the Boston Public Incidents website, and we recommend that the Boston Police Department verify whether the dates associated with the data uploaded to the site are being input correctly. For the purpose of the rest of our analysis, we focus solely on 2022.
Findings
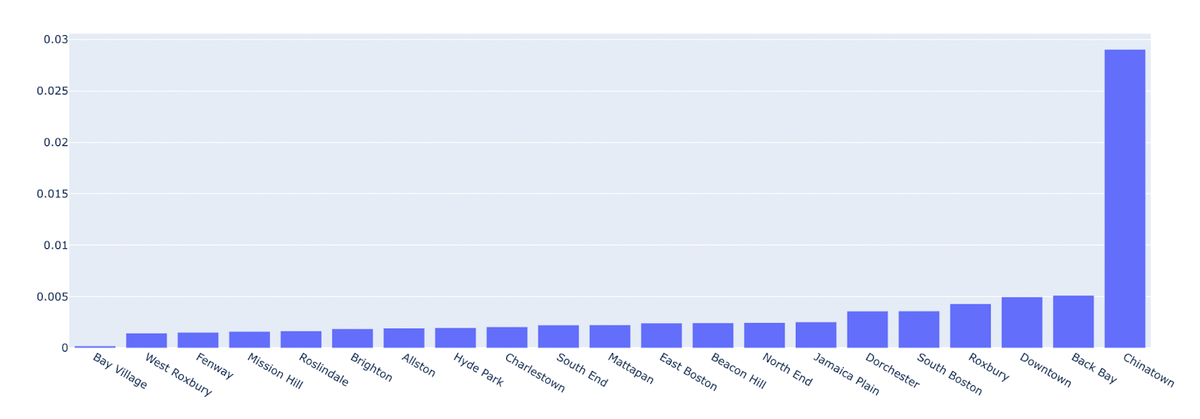
 Figure 1: Crime Rates by Neighborhood
Overall, Chinatown has the highest crime rate (~2.9% crime rate) with Bay village having the lowest crime rate. This may be due to Chinatown’s low population (it has the lowest population in the dataset) and its central location in downtown Boston. In Chinatown, there were 21 crimes committed and the population is 723 thousands.
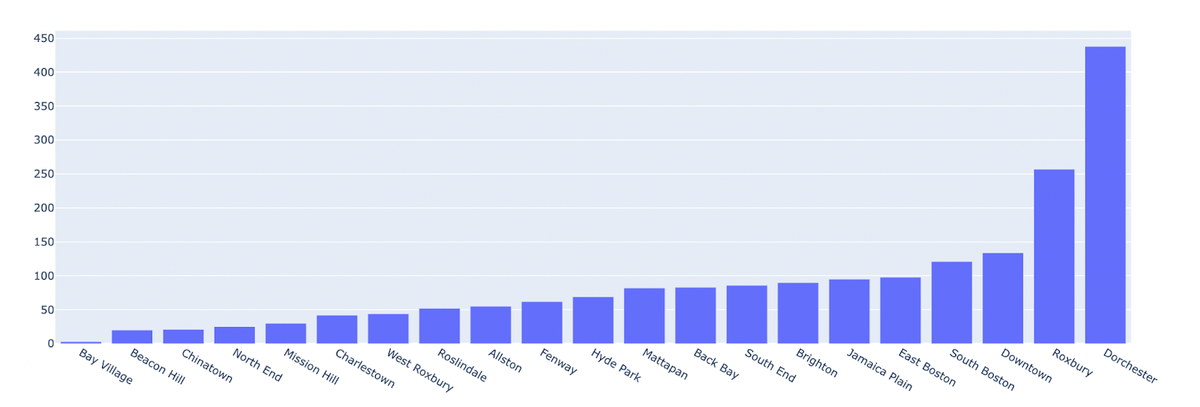
 Figure 2: Number of Crimes by Neighborhood
Merely looking at the number of crimes committed in a district, Dorchester (438), Roxbury (257) and Downtown (134) lead with the most amount of crimes. In contrast, Bay Village (3), Beacon Hill (20) and Chinatown (21) have the least number of crimes.
Comparing crimes by neighborhood and crime rates by neighborhood paints two very different pictures. Depending on the metric, it might be useful to pick either crimes or crime rates and factor in the population.
According to the police reports, crime rates were highest during the spring and summer months. This is consistent with national crime trends. This may be connected to increased blood pressure and heart rate due to summer heat, which can lead to discomfort, which researchers attribute to the correlation between high heat and increased anger and violence. People generally have more free time to spend outside during the summer, which is another likely cause. However, the dataset itself has many unrealistic flaws. It seems that the Boston police department is not consistent at collecting or marking their data, because the dataset contains very few observations from winter months.
For this graph, the plot depicts the most popular crime committed in each neighborhood in relation with the frequency of the incident. According to the crime reports, Dorchester has the highest number of verbal disputes in Boston. The approximate 37 incidents may be attributed to Dorchester being one of the most densely populated neighborhoods in Boston. However, the verbal dispute can be directly associated with specific factors that range from economic disparity to misunderstandings between the vast demographic of citizens in Dorchester. Analyzing similarities, we see that Harbor Island, Leather District, Longwood, South Boston Waterfront, and Bay Village all exhibited roughly equivalent counts of incidents for their most prevalent crimes. Although the type of crimes vary, the Longwood, Leather District, and Harbor Islands all have minor demeanors which encompass mostly some sort of shoplifting. But South Boston Waterfront and Bay Village specifically depicts assaults. Interestingly, the data emphasizes the correlation between assaults and neighborhoods that reside closer to the coast or waterfront. Lastly, the frequency of shoplifting crimes may be associated with these neighborhoods gaining a greater number of visitors and tourists which increase the likelihood of minor thefts.
The chart above displays the distribution of crimes throughout the day, showing the number of crimes committed at each hour. The hours are arranged according to the frequency of crimes committed during that hour. It is evident that the highest number of crimes occurred at midnight (t=0), followed by noon. There is a significant contrast between the number of crimes committed at midnight and those at noon.
Conclusion
Analyzing crime rate variations in different neighborhoods is key to making sure resources are allocated effectively and policing strategies are targeted where they’re needed most. By digging into crime patterns over time and across locations, Boston Law Enforcement can pinpoint areas that need attention and create plans to tackle the underlying factors—like situational and socioeconomic issues—that contribute to crime. This kind of analysis helps boost community safety by guiding where and when law enforcement efforts should be focused.
That said, the Boston Crime Dataset currently being used has some major flaws. It's not detailed or reliable enough to support the kind of in-depth analysis needed to make informed decisions. A better dataset would be crucial to generating useful insights and making sure public safety measures have a real impact across Boston’s neighborhoods.
