Harvard’s Most (and Least) Desired Houses Updated: Housing Day 2020
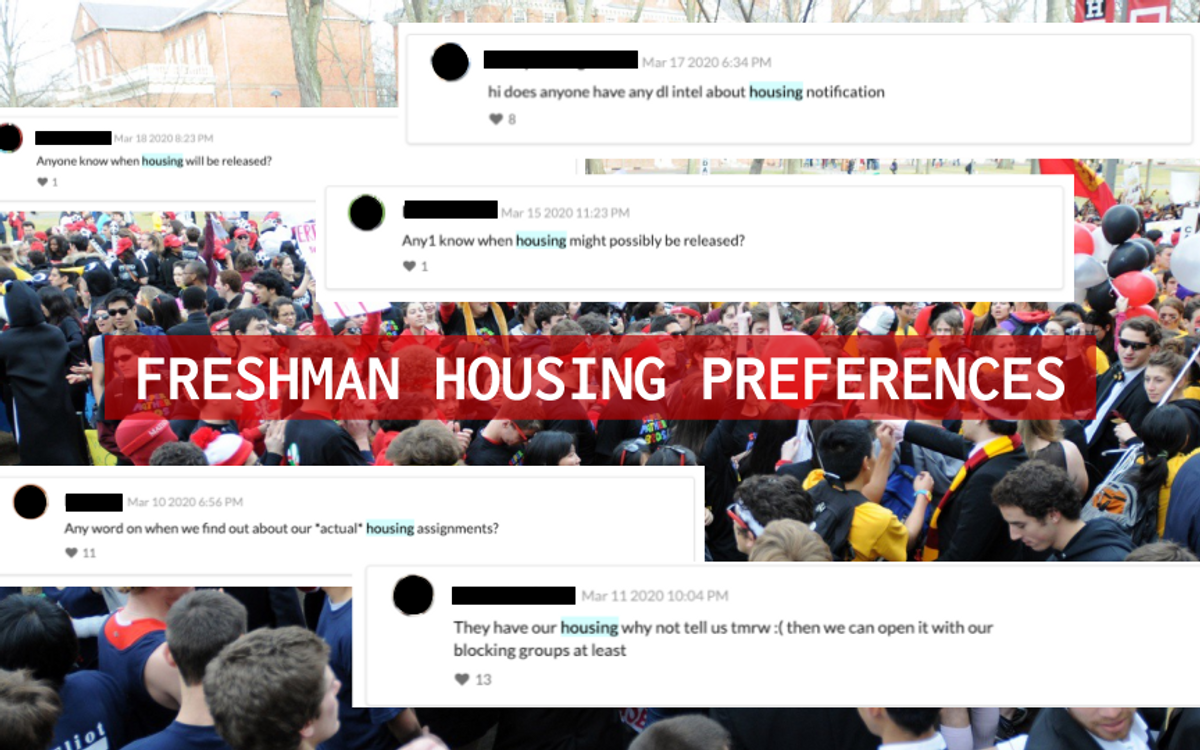
Four rhyming couplets and a desperate plea.
Every March, freshmen wait in high anticipation as they look forward to learning which House they will live in for the rest of their Harvard careers. But this year, unusual circumstances caused by the pandemic outbreak of COVID-19 have forced them to wait almost a month longer. So, whether you’re a freshman sitting on the edge of your seat anxiously waiting to receive their housing results or an upperclassman excited to learn about the new members of your House community, read on to find a data-driven analysis of housing preferences to hype up the wait.
The Harvard Open Data Project collected data from roughly 275 freshmen through a survey sent over various email lists and compiled all things housing-related. Students ranked all 12 upperclassman houses from 1 (most desirable) to 12 (least desirable), reported their blocking group size, and recorded other miscellaneous data.
Lowell Reigns, Adams Gains
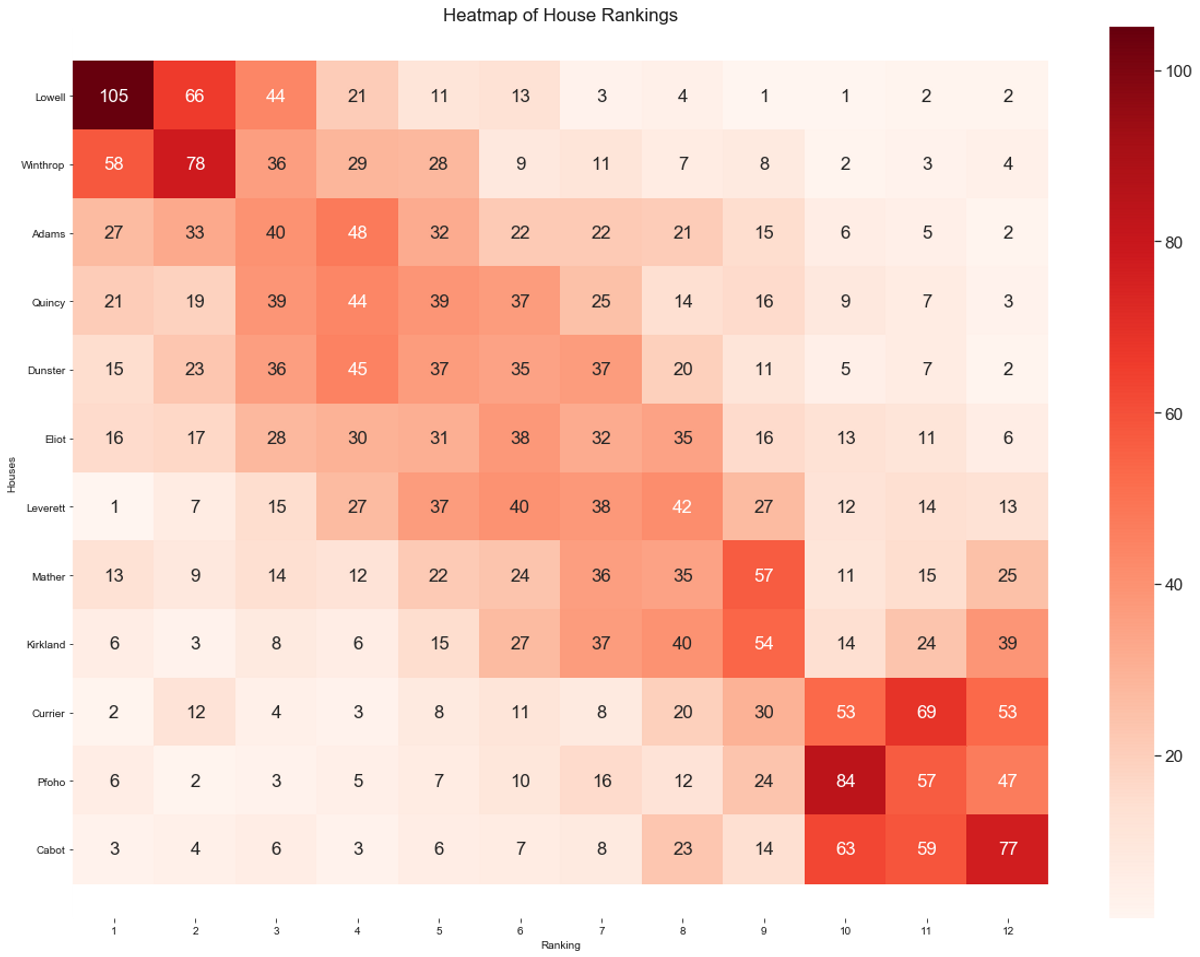
We observed the overall sentiment towards different houses by finding the average ranking given to each one by our survey respondents. In the plot below, a taller bar signifies a greater dissatisfaction with receiving a house. Lowell, Winthrop, and Adams took the gold, silver, and bronze, while the three Quad dorms were (unsurprisingly) given the lowest rankings.
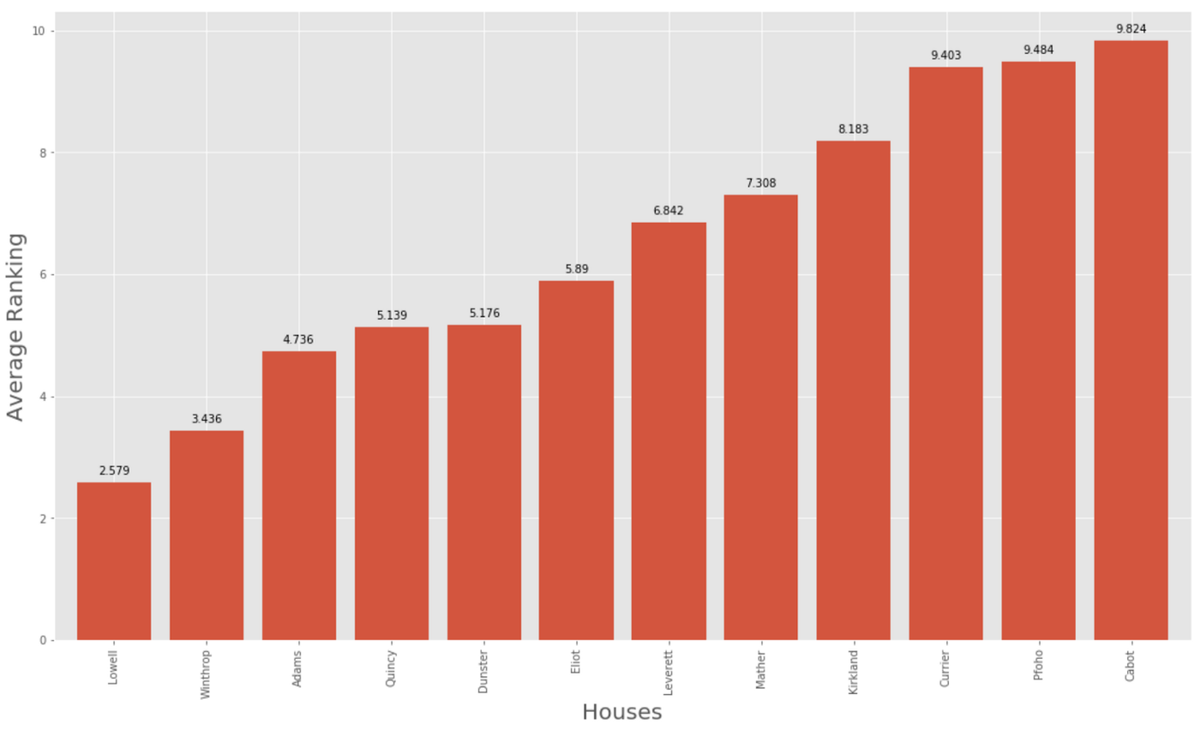
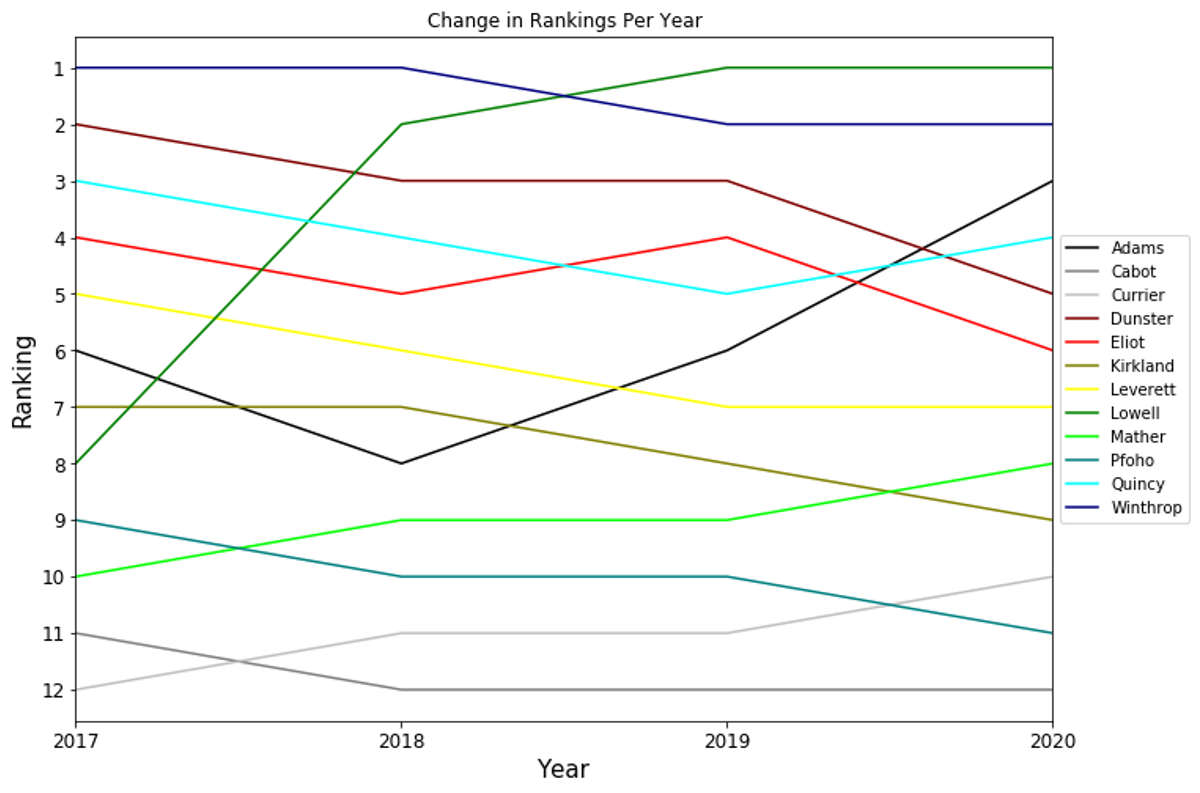
The results this year see a big leap in preference for Adams compared to last year and seems to be on the rise, jumping from 6th to 3rd this year and from 8th to 6th last year. This is likely attributed to the fact that Adams is one of the closest houses to the yard, and because residents will have the chance to live in swing housing and the Inn, due to the renovation that is slated to be finished in August 2023. Previous years’ data has shown that renovations for houses generally associated with an increase in preference for that house. Quincy also saw a gain in preference (5th to 4th) while Dunster and Eliot seemed less appealing to the class of 2023 (3rd to 5th and 4th to 6th respectively).
In the graph below, you can see the change in rankings for houses every year that HODP has collected data on housing preferences. Looking at the trends, we saw the Quad dorms being consistently ranked in the bottom three while Winthrop was consistently in the top two.
Crazy Eights, Floaters’ Fate
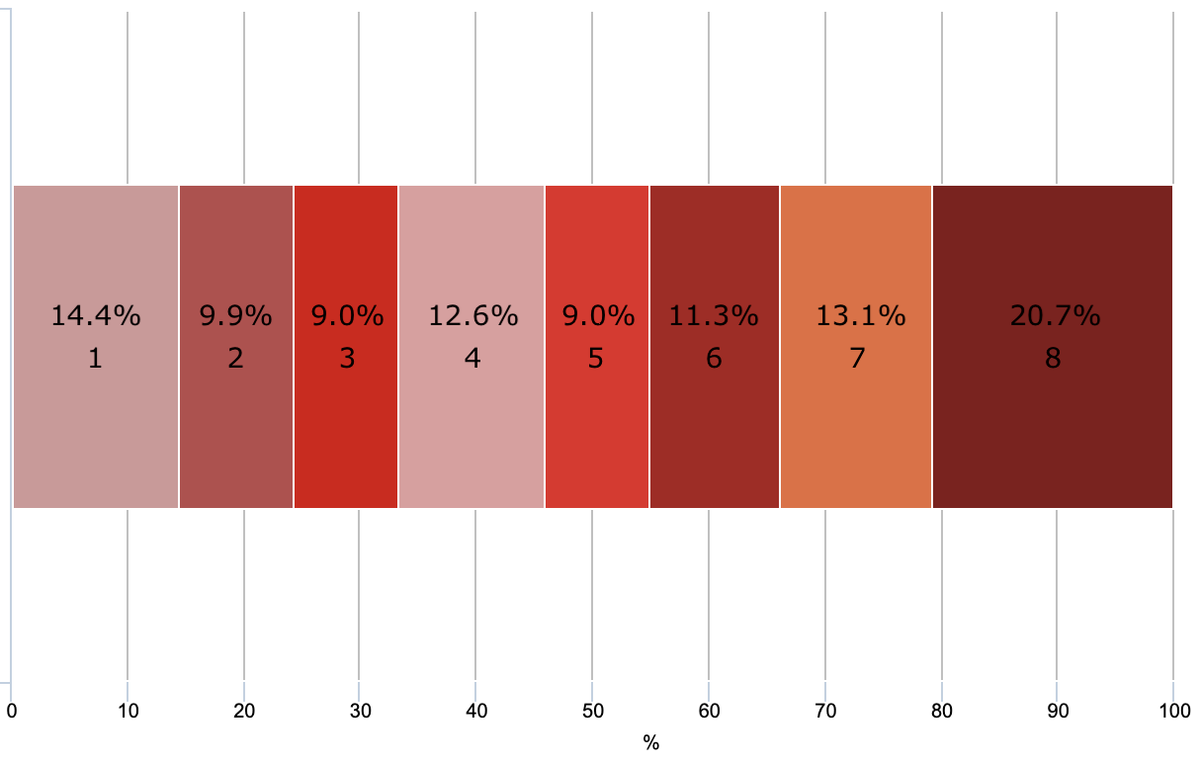
Similar to last year, we once again saw that the most popular blocking group size among respondents was eight, the maximum size for a blocking group. To determine this, we took the total number of blocking groups of each size and divided that number by the blocking group size. For example, with our total of 92 respondents reporting a group of 8, we divided 92 by 8 to get ~11.5% as the total number of blocking groups consisting of 8 people. The next most popular was a floater, or a single person, comprising 14.4% of blocking groups.
This is because smaller blocking groups are likely underrepresented in this survey, since those in larger blocking groups make up a larger proportion of the respondents. For example, if a person from one blocking group responded to this survey, they are more likely to share the survey with their blockmates and have them respond to the survey, which would happen more frequently in larger blocking groups. Although this method cannot account for all the confounding variables regarding blocking size, it provides a rough estimate.
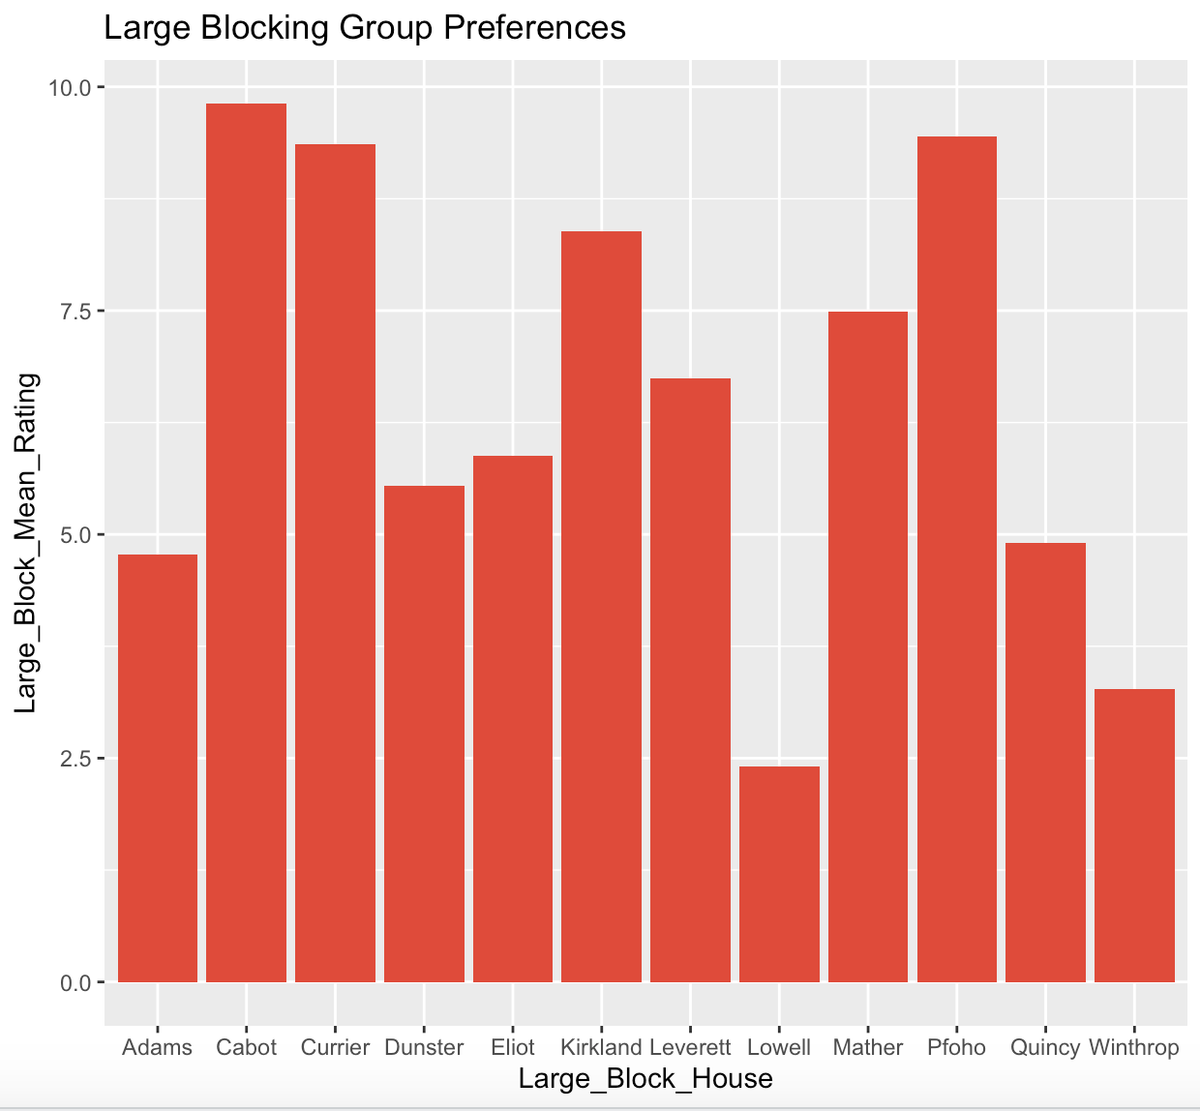
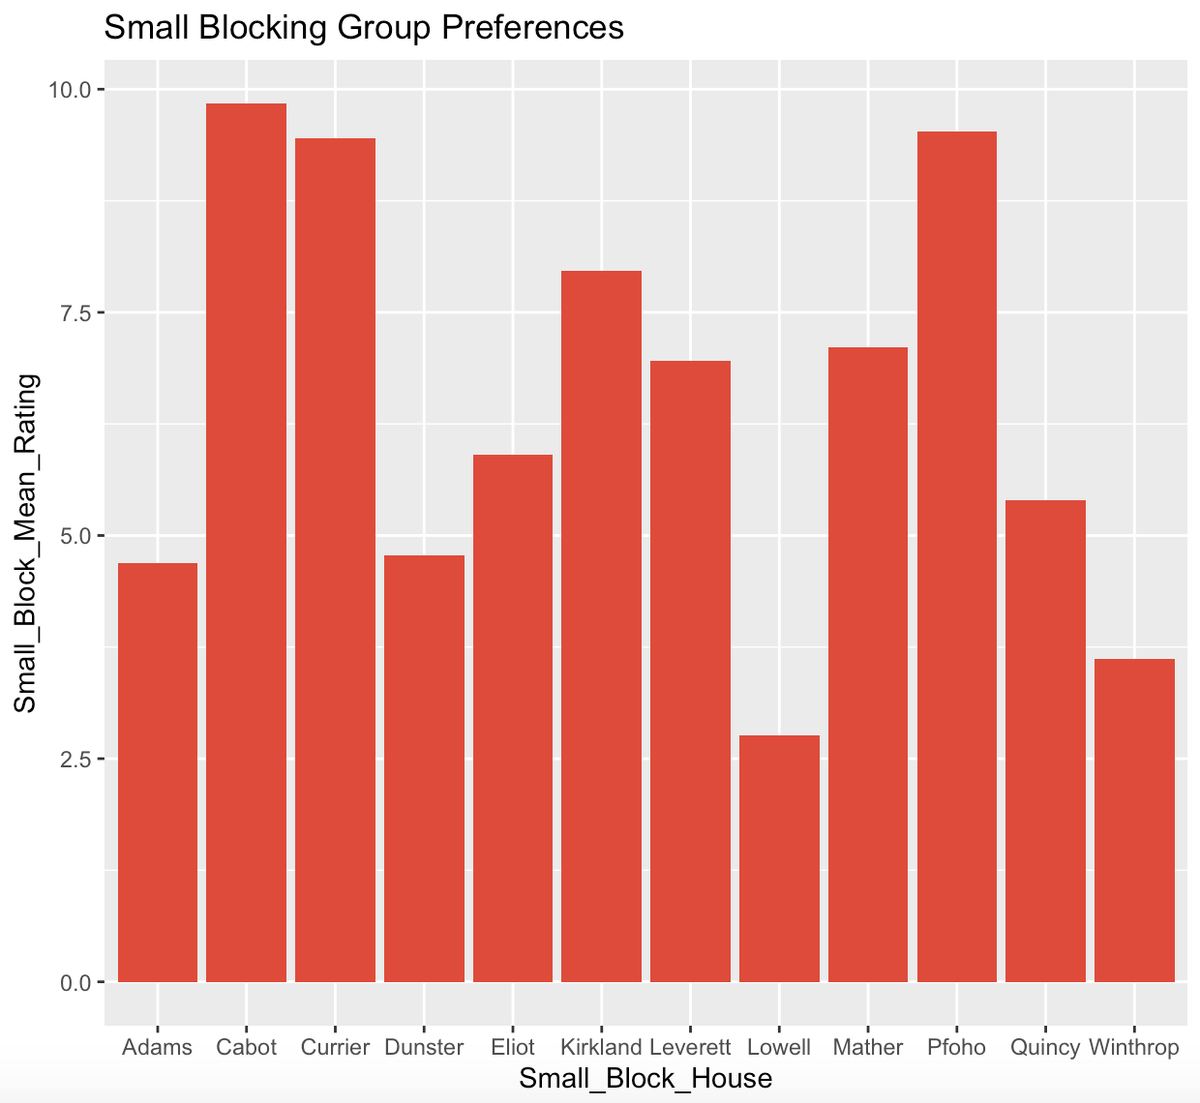
Additionally, smaller and larger blocking groups seemed to have almost identical preferences with regards to housing, as seen by the graphs above.
Wins Delivered, Athletes Choose the River
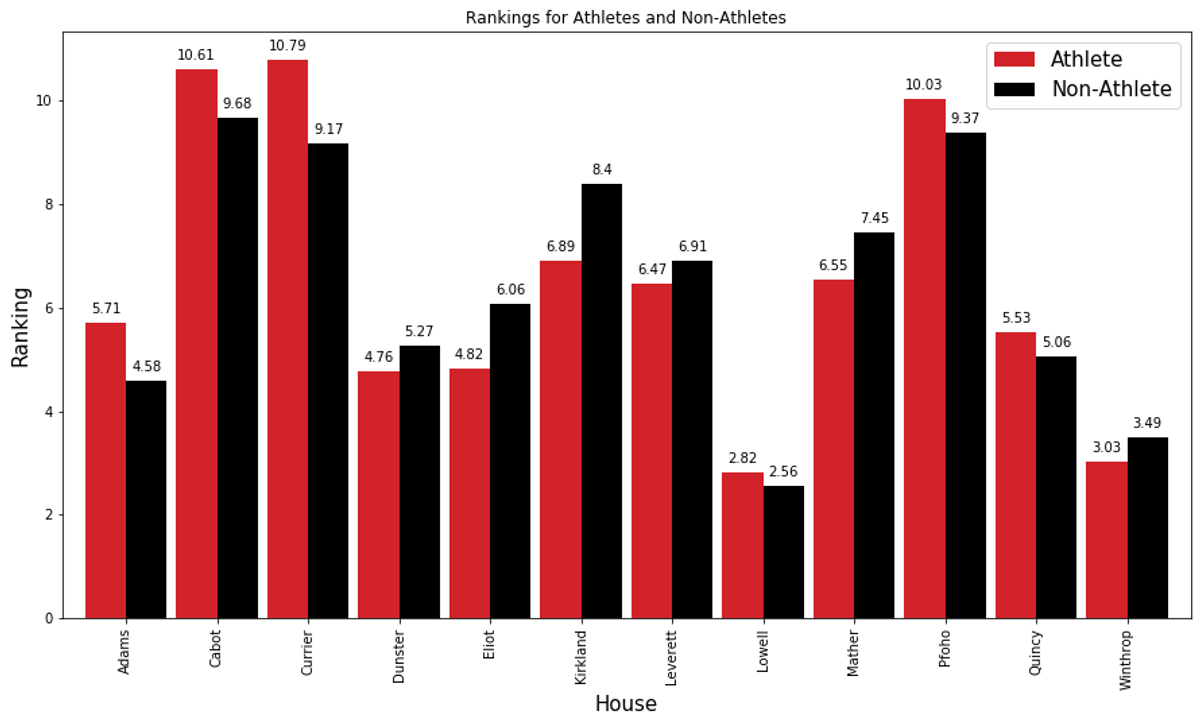
Varsity athletes gave Currier House an average ranking of 10.79 in comparison to the non-athlete ranking of 9.17. This difference is similarly large for the two other quad houses: Pfoho and Cabot. The explanations for the differences in ranking become less apparent when referring to the other dorms. Dunster has extended meal times to accommodate the demanding schedules of many varsity athletes. Elliot and Kirkland are particularly close to the athletic facilities. However, this phenomenon may be more influenced by athletes disproportionately ranking the quad low than anything else.
It is also interesting to note that athletes tended to favor Adams, Lowell, and Quincy less than their non-athlete counterparts — perhaps due those houses being a bit farther from the athletic facilities than other river houses. But in the end, if it’s not the quad, athletes applaud.
Across Concentrations, Quad Met With Damnation
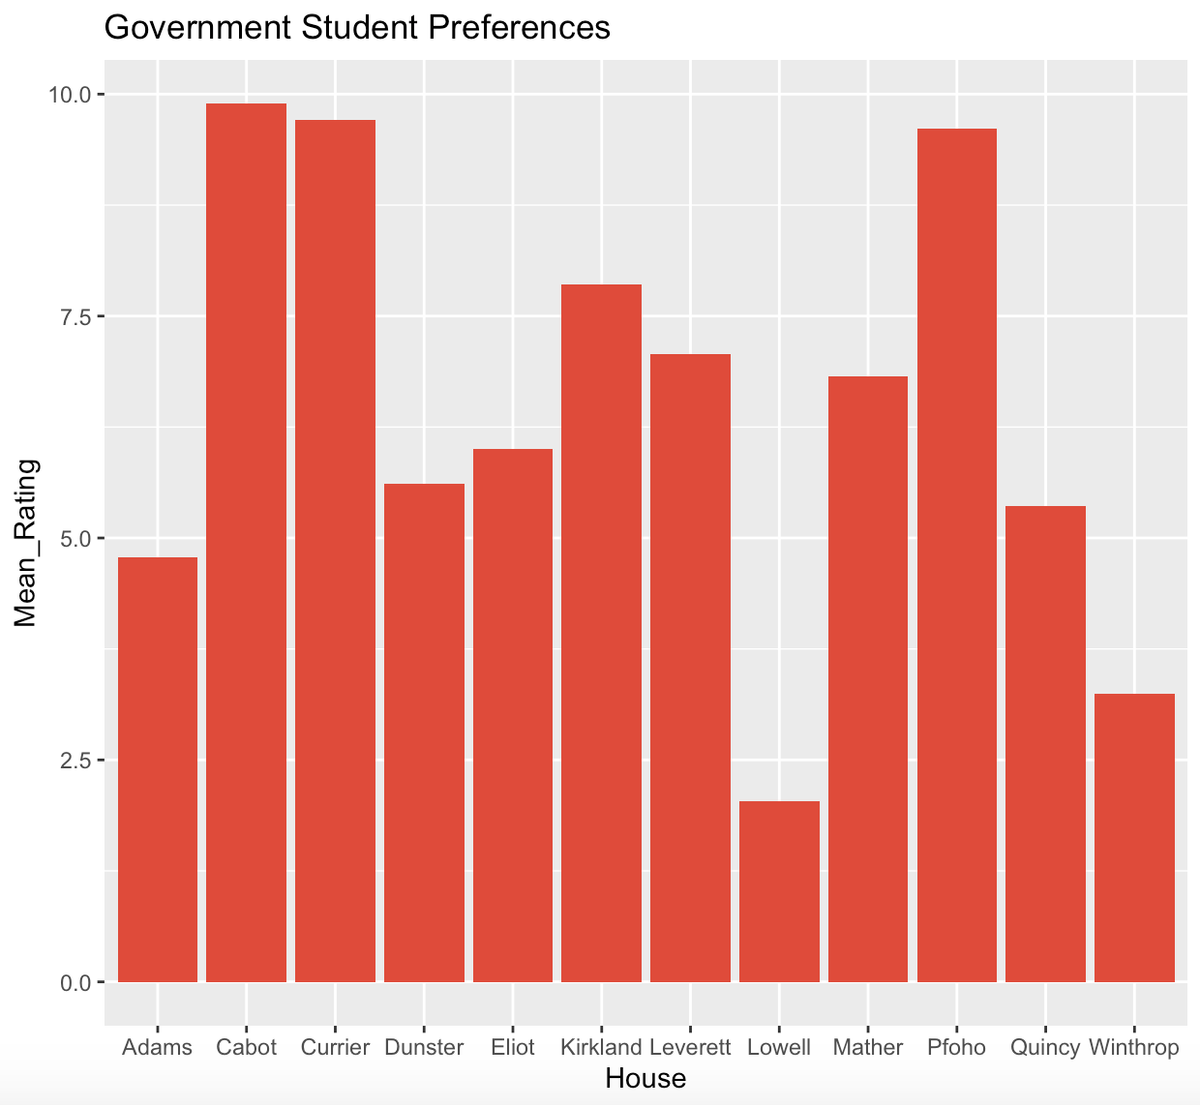
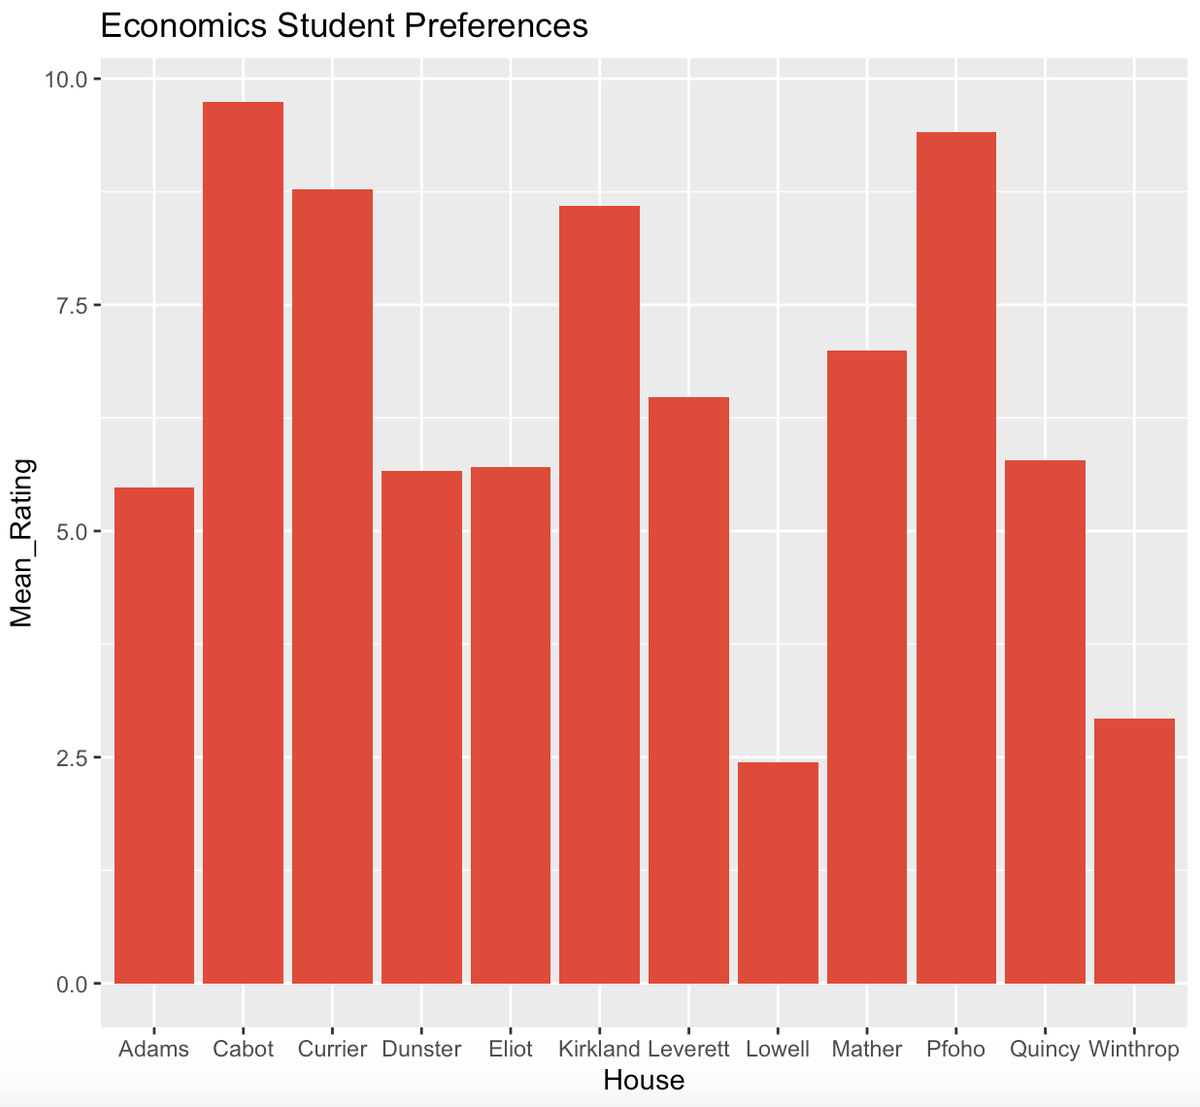
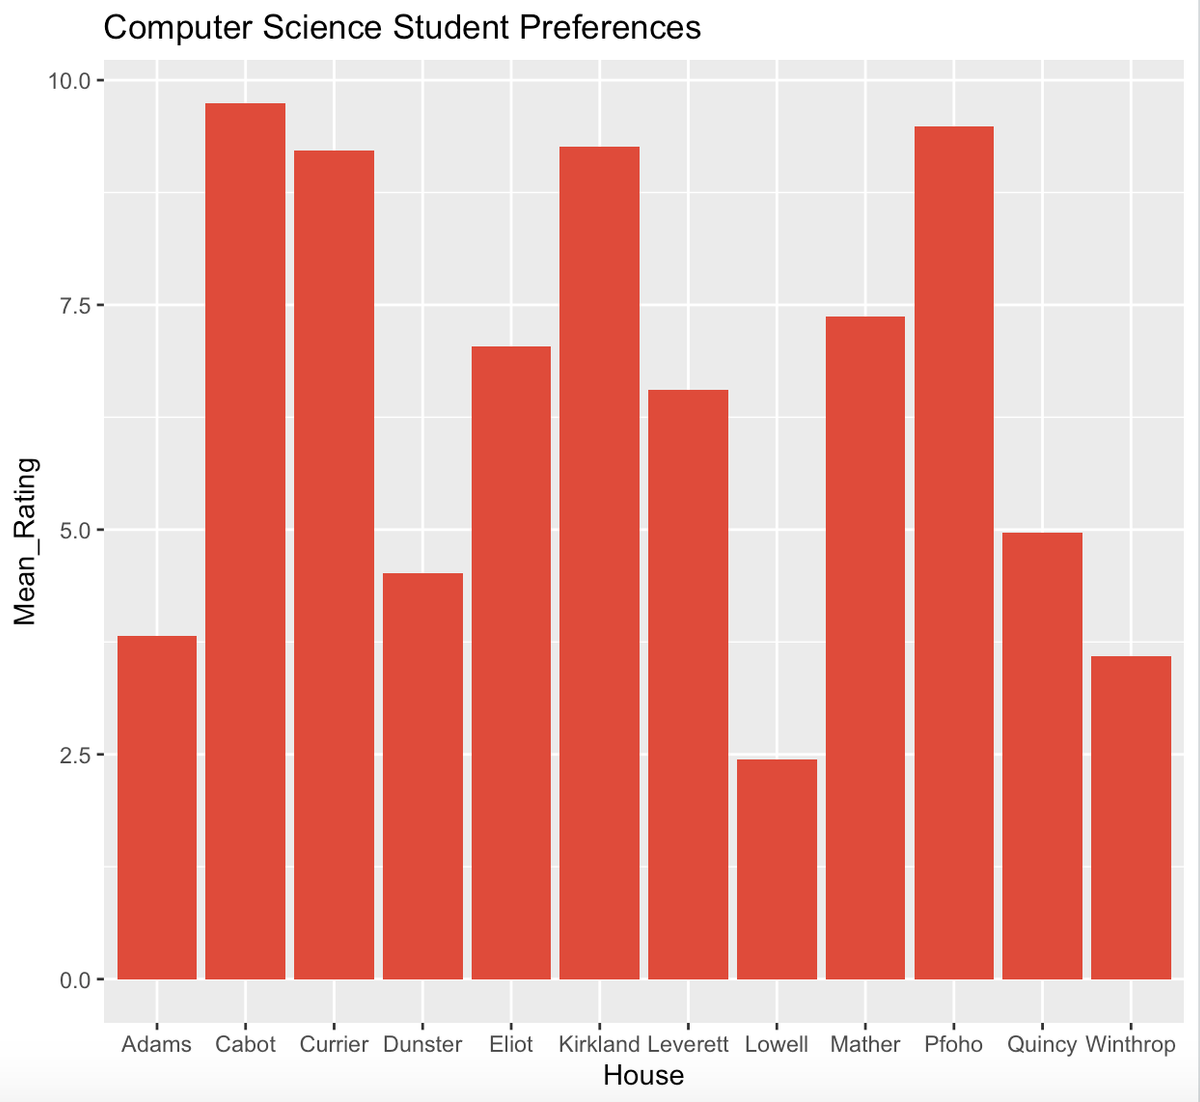
We chose to look at the preferences of the three most common concentrations at Harvard: Economics, Computer Science, and Government. Computer Science could be especially interesting because of the new Allston campus set to open in Fall 2020. Among all three concentrations, trends were similar to the overall rankings.
Additionally, Economics concentrators preferred Eliot to Quincy while the other two concentrations did not favor Eliot as much. However, differences in both cases were quite small.
We Just Want a House
So, we know that different types of people have different preferences for housing. “So what?” you might ask. Our next article will hopefully answer that question for you — we’ll be analyzing the housing results, which will be released soon. So even if you’re disappointed by the House that (storms your dorm) (emails you) Zoom-storms you (?), don’t worry. Whatever house you eventually get, you will learn to love it!
Wash your hands and stay safe!
